Test Management
Introduction
This administration guide is dedicated to the administrator of Gazelle Test Management and Gazelle Master Model tools. It explains how to configure the tool, how to manage users, systems and so on.
This document is applicable from version 5.0.0 of Gazelle Test Management.
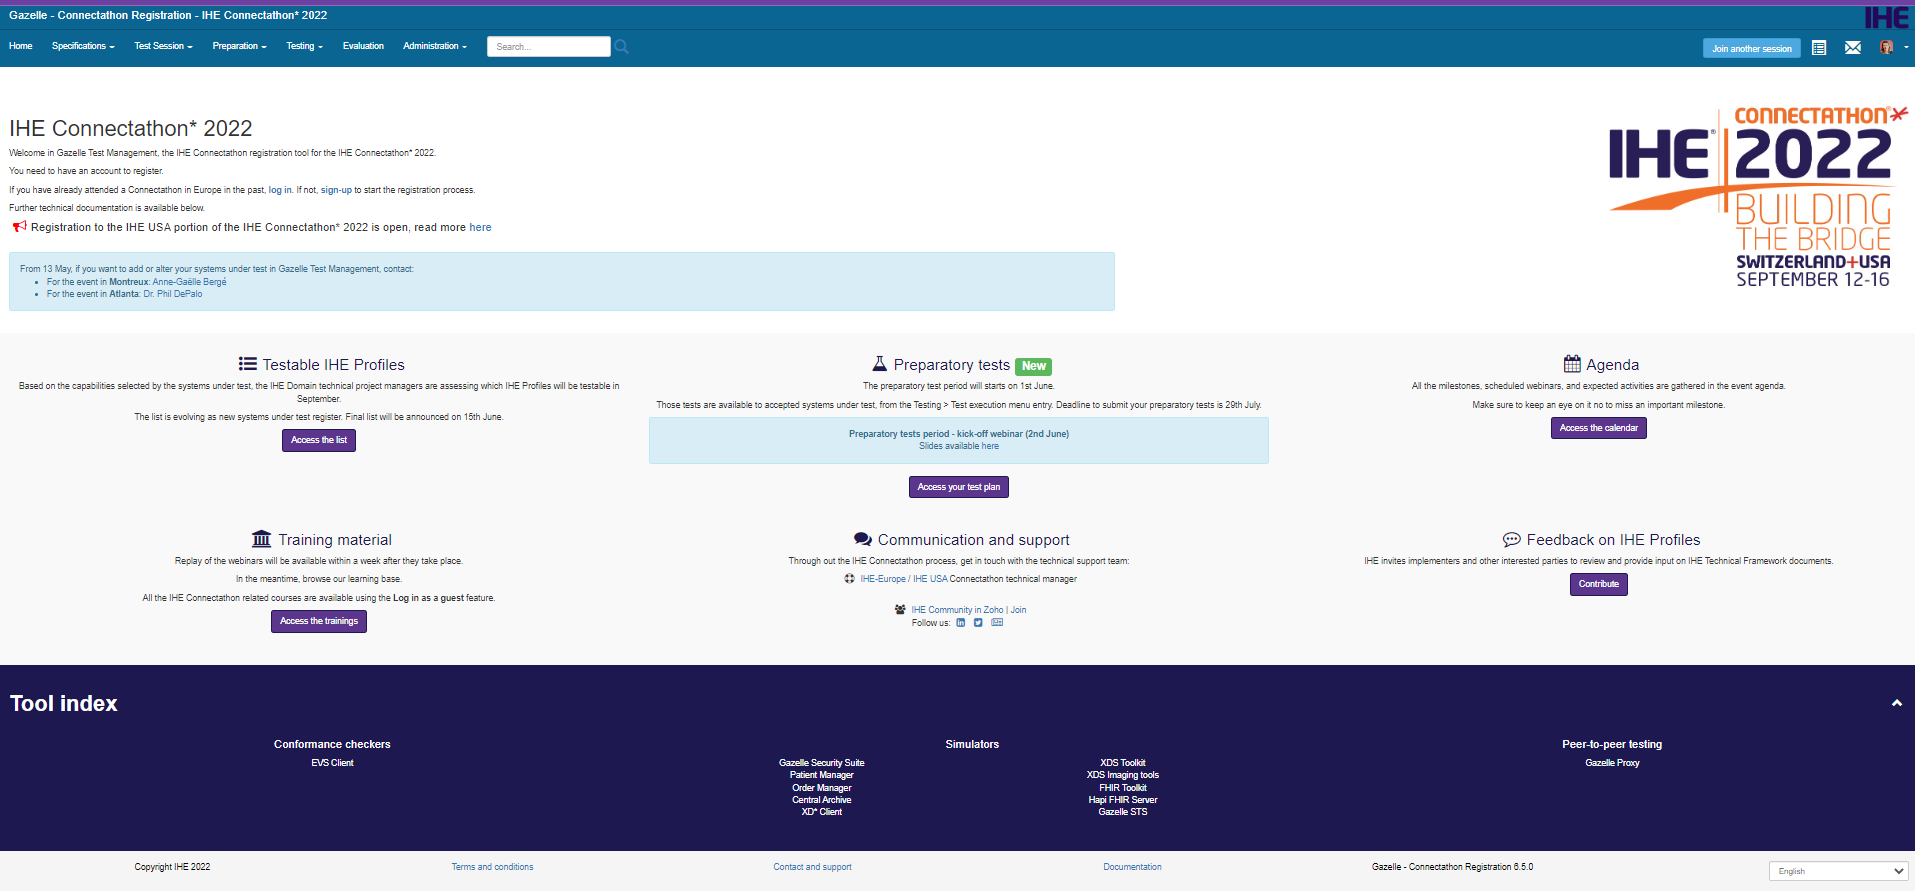
Home page
The home page of Gazelle Test Management can be customized for your needs. This page is made of three sections: Announcement section: by default with a white background, Documentation section: by default with a light-grey background, Tool index: by default with a blue background.
All the three sections are fully editable using HTML. From version 6.4.0, the contents shall be editable directly in the database. Our plan is to add an editor in a future release (short-term). The HTML code you insert can reuse Gazelle CSS classes (most of them are derivative of Bootstrap), and Font Awesome icons.
From version 6.4.0, when the user is logged in with role vendor or vendor_admin, the announcement section is replaced by the “Test session process” section. Other roles still see the announcement until we have implemented more content. This section is not configurable. Content is hard coded.
Configuring the home page
Updating the Documentation section: update tm_section set content = 'YOUR HTML CODE' where name='Documentation';
Updating the Announcement section: update tm_section set content = 'YOUR HTML CODE' where name='Announcement';
Updating the Tool index section: update tm_section set content = 'YOUR HTML CODE' where name='ToolIndex';
Sample content is available below:
- Announcement: Two columns (text + image)
- Documentation: Two rows of three columns. Each cell has a title with a icon.
- Tool index: Tools are organised into three categories.
Test session process section
See details in the (User manual)[./user.html#test-session-process-section]
Configuration of the application preferences
The configuration of gazelle TM is done through the menu Administration→ Application Preferences
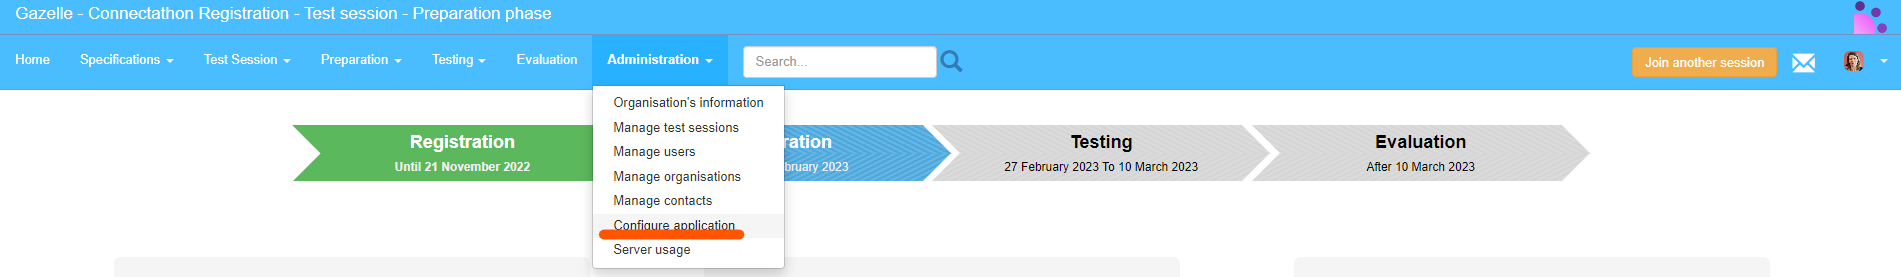
This page contains multiple sections allowing to configure the different behaviours and modules of gazelle.
Application mode
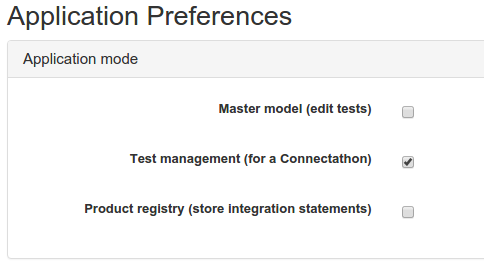
This section allows to configure the different modes of the gazelle TM application.
Gazelle TM can be configured into three modes, and four configurations:
- Master Model: gazelle act as editor of profiles, samples, and tests plan (example GMM: https://gazelle.ihe.net/GMM/)
- Test management (for a Connectathon): used when gazelle act as manager of CAT testing sessions
- Product registry (store integration statements): gazelle used in this mode to store the integration statements
Gazelle can act as
- Master Model
- Test Management
- Master Model and Test Management
- Product Registry
Any other configuration will make the tool out of use
Application settings
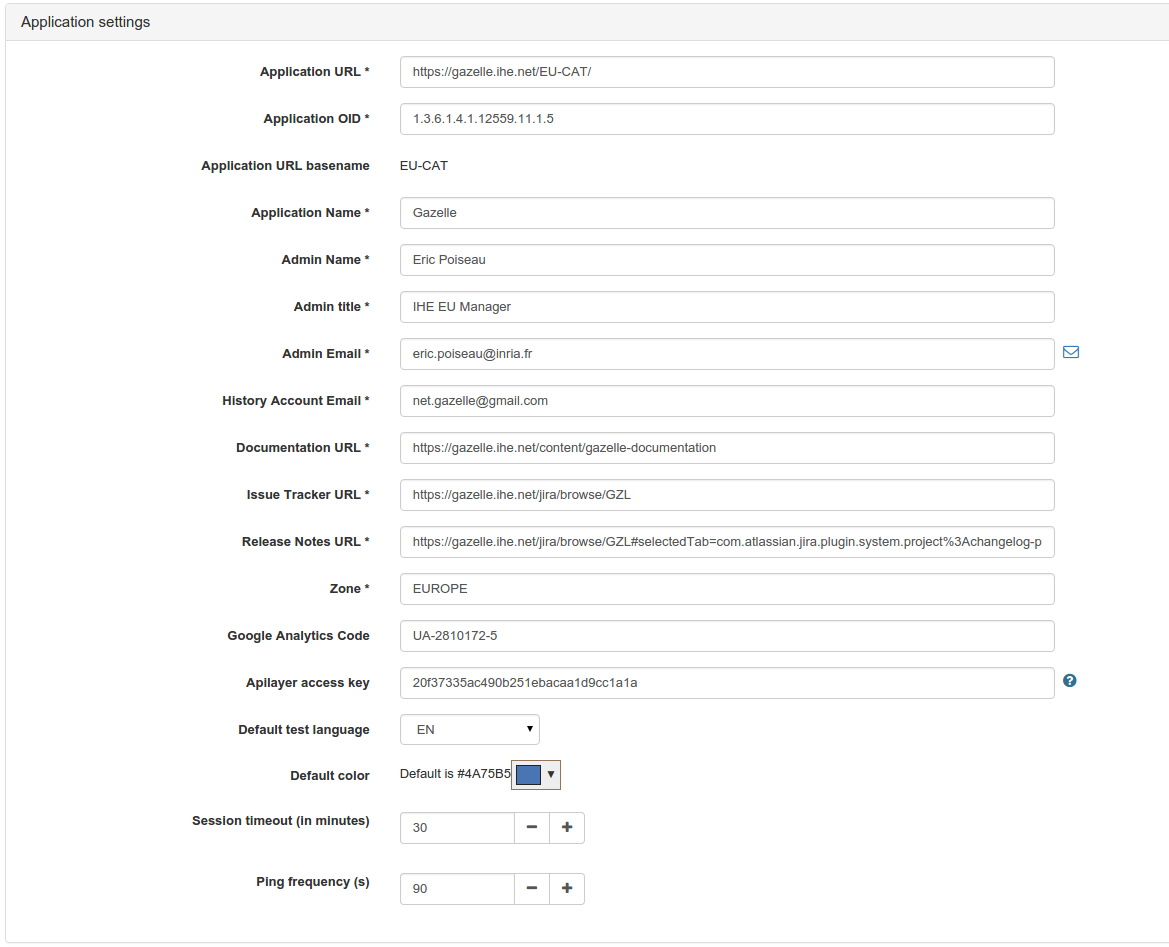
This section allows to configure the different administration properties of gazelle TM, which are:
- Application URL: the URL to gazelle application (example: https://gazelle.ihe.net/EU-CAT/). This attribute is used to create permanent links into the application to the test plan, test instances, etc.
- Application OID: the unique identifier of gazelle instance (example: 1.3.6.1.4.1.12559.11.1.5). This element is used to create permanent identifiers into the application
- Application URL base name: the base name of gazelle TM instance (example: EU-CAT)
- Application Name: the name of gazelle instance (example: gazelle)
- Admin Name: the administrator’s name
- Admin title: the function of the admin
- Admin Email: Please pay attention when configuring the admin email, it is currently the email used to send email with the application (lost password, activation link). Thus this email should have the same domain name as the machine on which this instance of Gazelle Test Management is installed. If not mails may end in spam or be rejected. It is thus strongly recommended to use no-reply@domainname
- History Account Email
- Documentation URL: the URL to the documentation of gazelle
- Issue Tracker URL: the URL to the jira tool
- Release Notes URL: URL to release note
- Zone: example : EUROPE
- Google Analytic Code: the identifier of GCA
- Default test language: the default language of test plan descriptions
- Default colour: the default skin of the tool
- Session time-out (in minutes)
- Ping frequency (s): the frequency to update the status of sessions (example : 30)
Messages
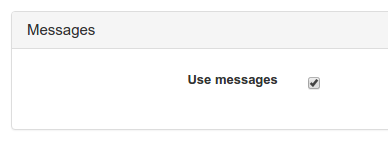
This section describes the ability to uses messages modules into gazelle. When allowed, the monitors and the vendors are notified of the status and changes into their test instances.
Assertions
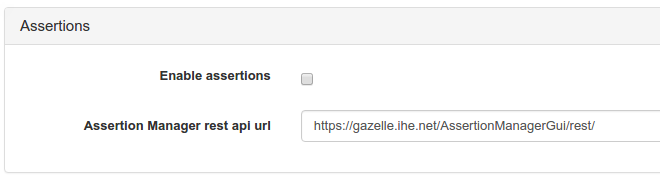
Allows to show or to hide assertions link to a test. This sections is linked to assertion manager via the property ‘Assertion Manager rest api url’ (example: https://gazelle.ihe.net/AssertionManagerGui/rest/)
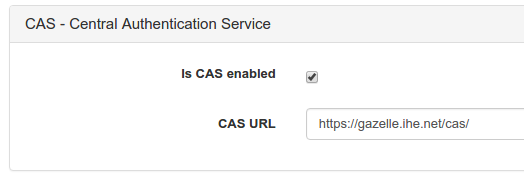
CAS - Central Authentication Service
This section allows to link the gazelle TM to a cas service, or to use local database of the TM tool.
Deploy section
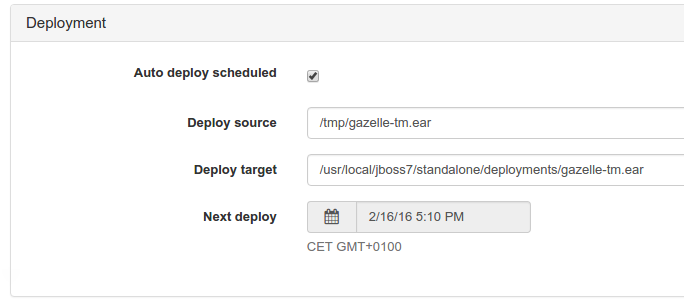
The deploy section allows to schedule deployment of gazelle TM ear into a jboss server. This section contains 4 elements:
- Auto deploy scheduled
- Deploy source : the path to the ear to be deployed
- Deploy target: the path to the ear in the jboss server
- next schedule : the next time of deploying
Cache section
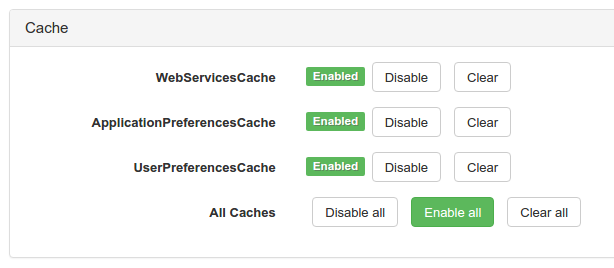
Allows to reset the cache used with gazelle (for developers, the cache used is ehCache).
Jira
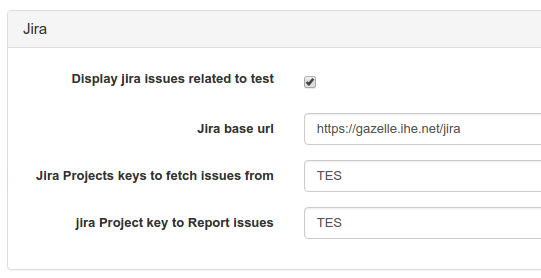
Allows to link gazelle TM to the jira used, and then vendors can report problems encountered in tests descriptions or test steps.
Available attributes:
- Display Jira issues related to test
- Jira base URL
- Jira Projects keys to fetch issues from: List of project keys (comma separated) that store test issues
- Jira Project key to Report issues : Test issues will be reported in this project
Security
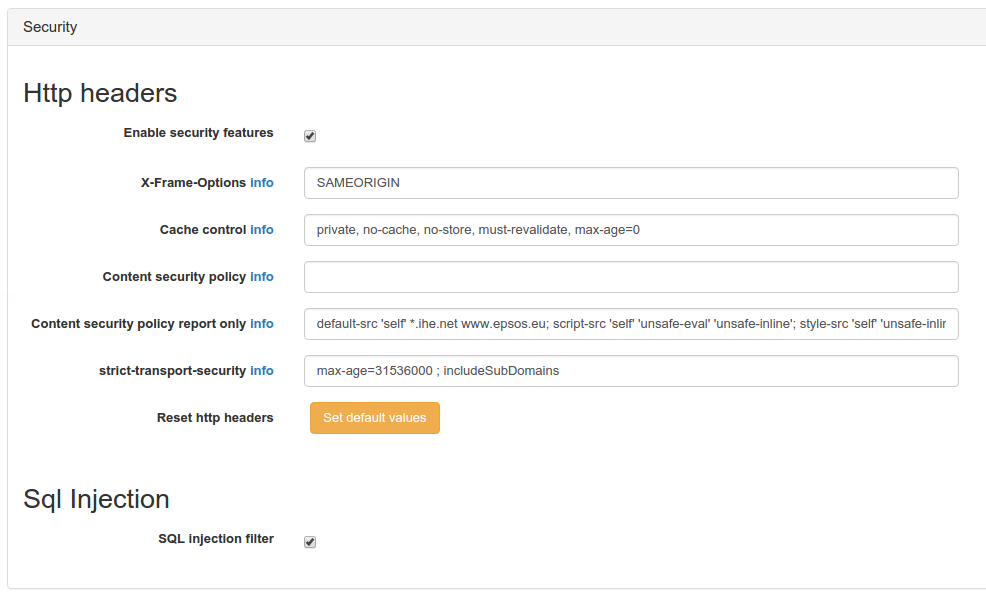
This section allows to describes the different HTTP security attributes related to gazelle.
New features added to improve the security of applications developed by IHE-Europe The audit security was done by two external teams. Improvement added :
- CSRF (cross site request forgery)
- SQL injection filter
- HTTP Headers security enforcement
- Better cookies management
| Pref key | kind Pref | value | description |
|---|---|---|---|
| security-policies | Boolean | true | Enable or Disable http security headers |
| sql_injection_filter_switch | Boolean | true | Enable or Disable Sql Injection filter |
| X-Content-Security-Policy-Report-Only | String | default-src ‘self’*.ihe.net; script-src ‘self’ ‘unsafe-eval’ ‘unsafe-inline’; style-src ‘self’ ‘unsafe-inline’; | To verify that the content of the site is provided only by domain specified (trusted domain) (report only!) |
| X-Content-Security-Policy | String | To force that the content of the site is provided only by domain specified (trusted domain) |
Gazelle validators

MESA tests
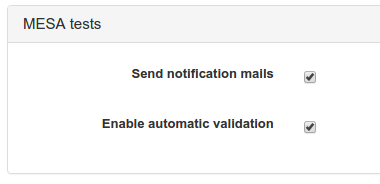
This section allows to configure the behaviour of pre-cat tests : automatic validation and mail notification
Certificates

Provides a link to the TLS tool
External Validation Service Front-end
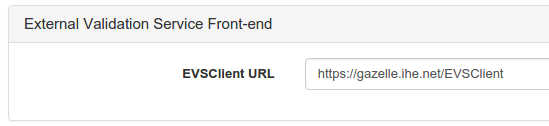
Provides a link to EVSClient tool
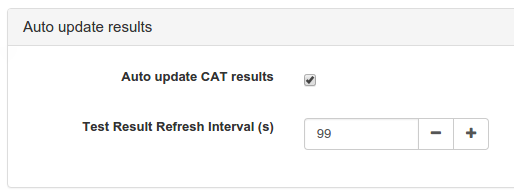
Auto update section
This section describe a module in gazelle allowing to update the relationship between Results of testing session, and the systems participating. This section contains two attributes:
-
Auto update CAT results : this section shall be selected during testing session registration and execution, no need to it otherwise
-
Test Result Refresh Interval (s): the interval of updates
Proxy
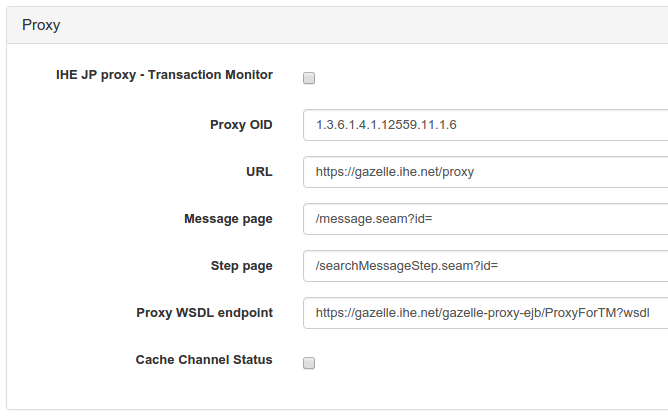
This section describes the proxy tool informations
TLS
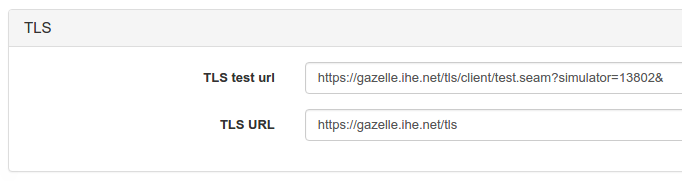
Link to the Client simulator related to gazelle
QR Codes
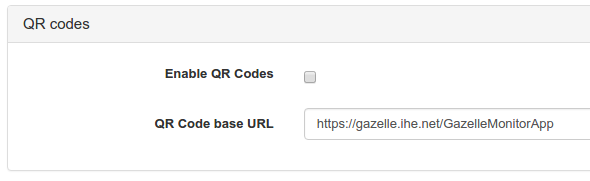
If the option is enabled, a QR Code is generated for each test instance, it represents the parametric URL to access the test instance information from the Gazelle Monitor App tool, designed for mobile devices.
DDS - Demographic Data Server
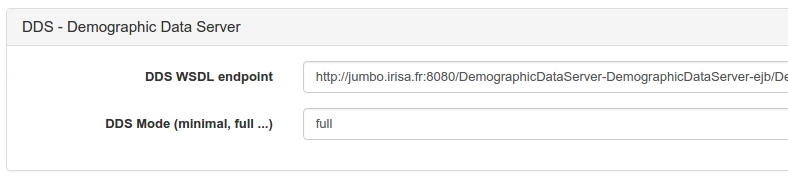
Link to the Demographic Data Server tool used to generate patient demographics for testing needs.
Order Manager section
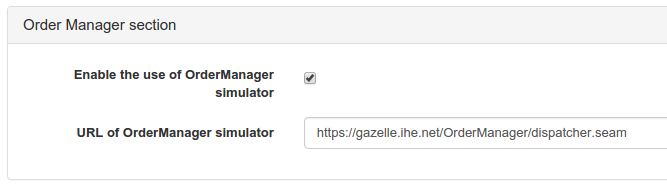
Link to Order Manager tool. In some cases, we ask the Connectathon participant to create DICOM Modality worklists. Do to so, they can use the Order Manager tool and share patient demographics between Gazelle Test Management and the simulator.
Files/Paths Management
List of directories used by Gazelle Test Management to store files on disk.
Users Administration
The admin can manage user registration, for all the companies, vendor_admin can do so for users registered for his company.
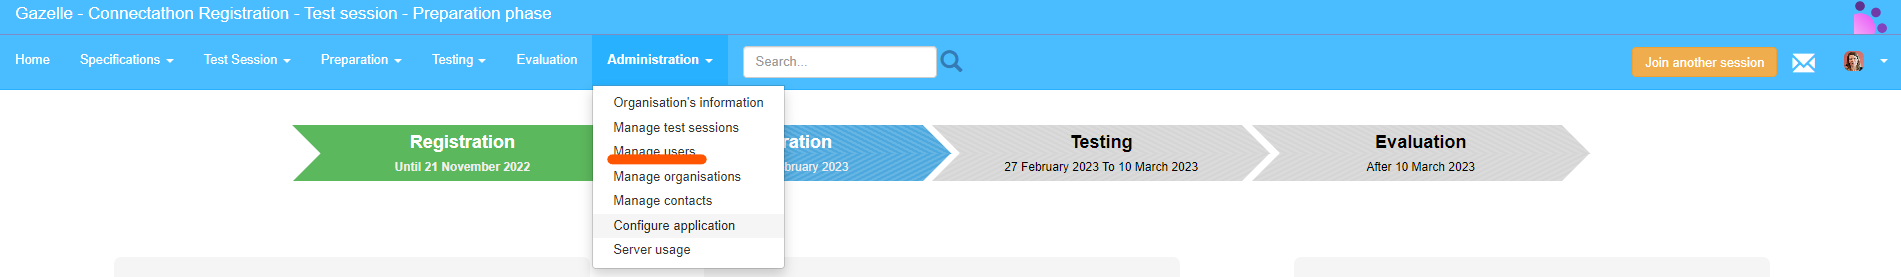
To do so, the admin shall go to menu → Administration → Manage users
The GUI of the users administration page looks like this:
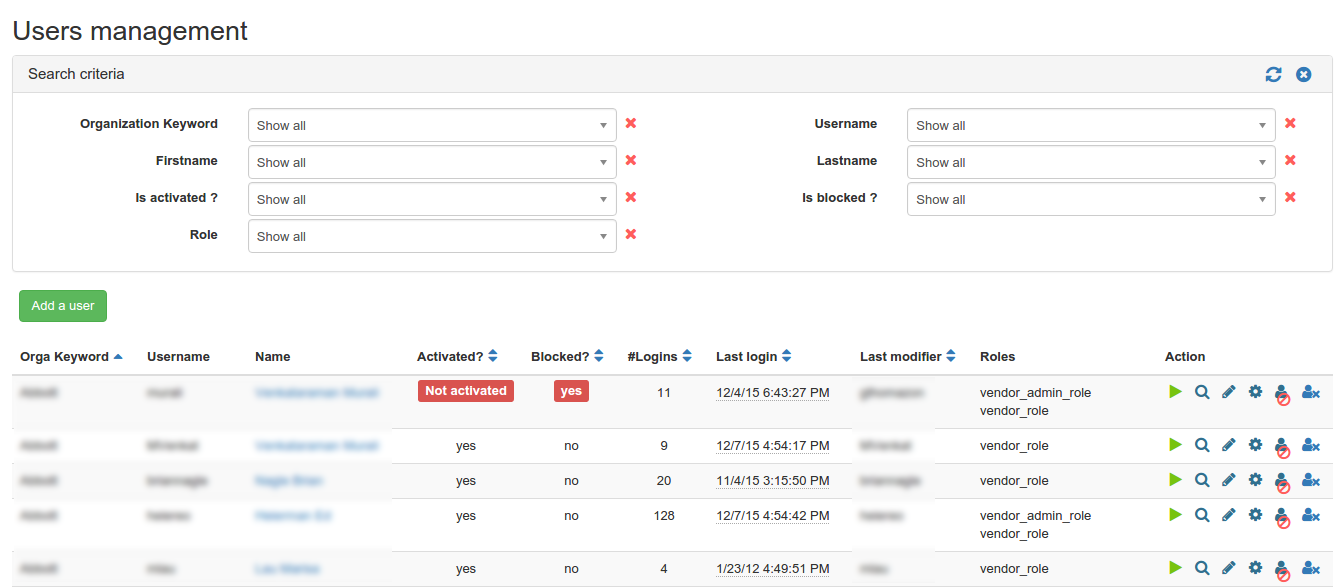
The admin has the possibility to filter users by
- organization
- first name
- active users
- role of users
- user name
- last name
- blocked or not blocked users
The table that show the list of users contains the following information:
- Organization keyword
- user name
- name
- activated
- blocked
- number of logins
- last login date
- last modifier’s user name
- the roles affected
The administrator is able to
- create new user
- edit old users
- view information of a user
- connect as a user !
- disable user account : the delete act as ‘block’, the user is not really deleted from the database
Add users
To add user the admin shall click on the button ‘add user’
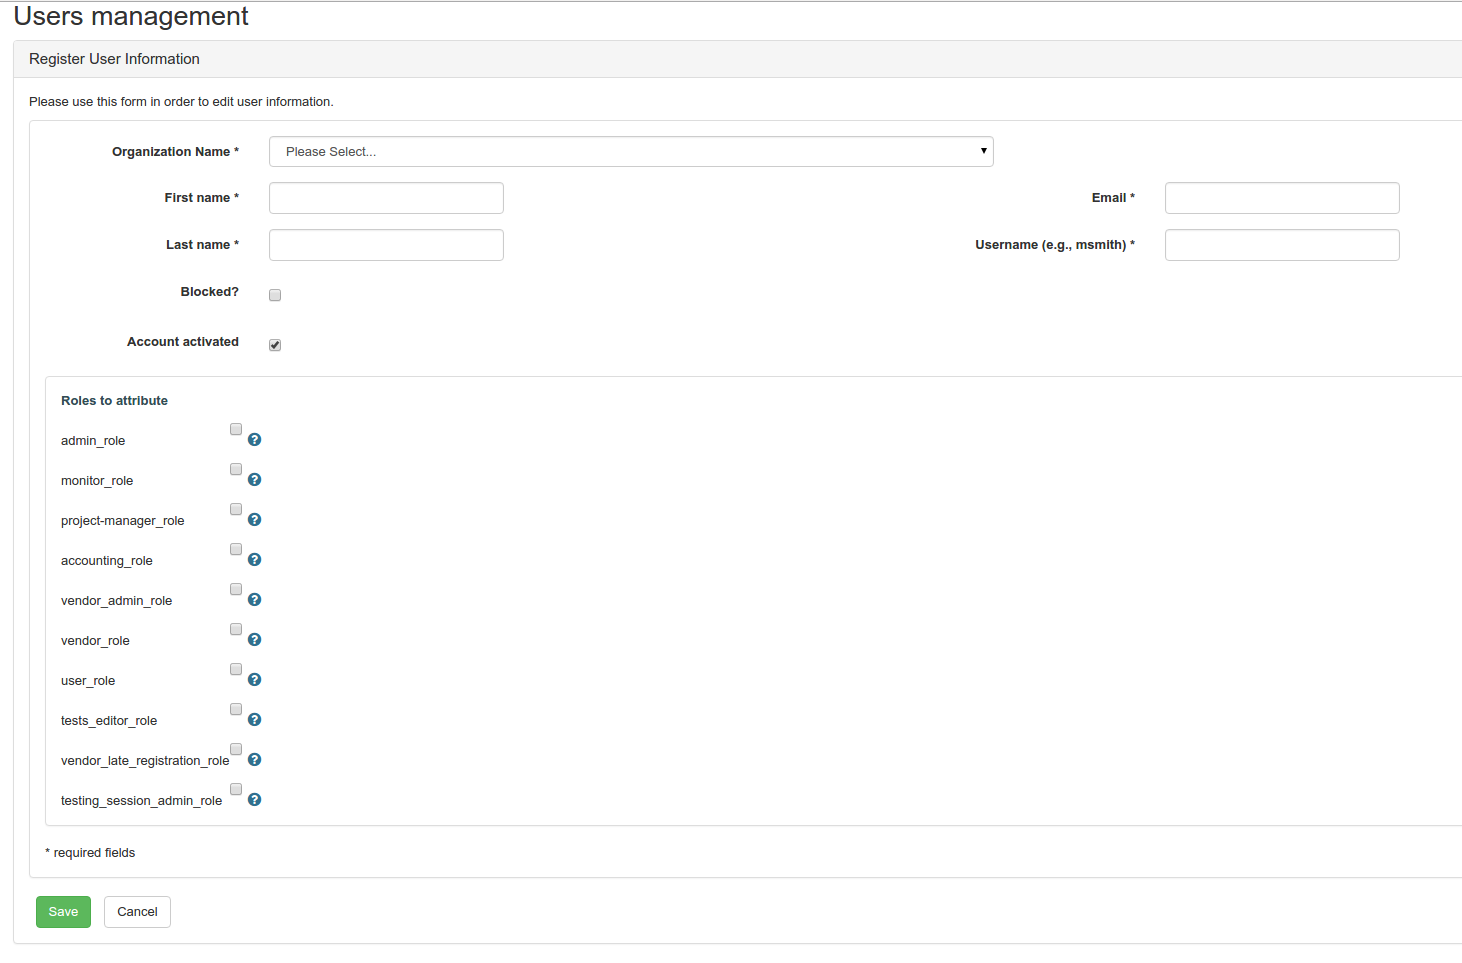
The page for adding users contains this information: The name of the organisation the user belongs to
- first name
- last name
- email (shall be a valid mail, and so the user can activate it, and the reset his password, etc)
- user name
- blocked?
- account activated
- the list of role attributed:
| Role | Description |
|---|---|
| admin_role | The admin role is responsible to manage gazelle |
| monitor_role | A monitor for gazelle testing sessions |
| project-manager_role | a project manager in gazelle (rarely used) |
| accounting_role | |
| vendor_admin_role | an admin of a system / organization |
| vendor_role | a simple vendor |
| user_role | a user |
| tests_editor_role | a test editor role -> allowed to edit test plans |
| vendor_late_registration_role | a vendor who is lately registered to a testing session ( this allows to register even if the session is closed) |
| testing_session_admin_role | An admin for a specific testing session |
The following table describes what a user can do and cannot do:
| Fonction | admin | monitor | project-manager | accounting | vendor_admin | vendor | |
|---|---|---|---|---|---|---|---|
| Organization management | |||||||
| Edit institution | x | x | x | x | |||
| Delete institution | x | ||||||
| View institutions list | x | x | x | ||||
| View institution summary | x | x | x | x (only his company) | x (only his company) | x (only his company) | |
| Access institution web site | x | x (only his company) | |||||
| Access users list | x | x (only his company) | |||||
| Access contacts list | x | x (only his company) | |||||
| Access invoice | x | x (only his company) | |||||
| System management | |||||||
| Add system | x | x | x | x | |||
| Edit system summary | x | x | x (only his company) | ||||
| CRUD Actor/Profiles for a system | x | x | x (only his company) | ||||
| CRUD Demo for a system | x | x | x (only his company) | ||||
| Delete system | x | x | x (only his company) | ||||
| View system | x | x | x | x | x | x | |
| View systems list | x | x (all companies) | x | x (only his company) | x | x | |
| Generate Integration Statement | x | x | x | x | x | x | |
| Check missing dependencies | x | x | |||||
| Add missing dependencies | x | x | |||||
| User Management | |||||||
| Create user | x | x | x | ||||
| Edit user | x | x | x | ||||
| Delete user | x | x | x | ||||
| View User | x | x (only his account) | x | x (only his account) | x | x (only his account) | |
| List all users | x | x (only his account) | x | x (only his company) | |||
| Update user preferences | x | x (only his account) | x (only his account) | x (only his account) | x (only his account) | x (only his account) | |
| Create/Update user picture | x | x (only his account) | x (only his account) | x (only his account) | x (only his account) | x (only his account) | |
| Change password | x | x (only his account) | x (only his account) | x (only his account) | x (only his account) | x (only his account) | |
| password lost | x | x (only his account) | x (only his account) | x (only his account) | x (only his account) | x (only his account) | |
| Contact management | |||||||
| Create contact | x | x | x | x | ??? | ||
| Edit contact | x | x | x | x | ??? | ||
| Delete contact | x | x | x | x | |||
| List contacts | x | x | x | x (only his company) | x (only his company) | ??? | |
| Invoice and contract management | |||||||
| Create invoice | x (automatic) | x (automatic) | x (automatic) | x (automatic) | x (automatic) | ||
| Edit financial summary | x | x (in institution page) | x (in institution page) | ||||
| Edit invoice | x | ||||||
| Delete Invoice | x | ||||||
| View Invoice | x | x | x | ||||
| Download PDF Contract | x | x | x | ||||
| Generate PDF Invoice | x | ||||||
| Generate report of financial overview of all companies | x | x | |||||
| List invoices | x | ||||||
| Test definition Management | |||||||
| Add / Edit a test | x | NA | NA | NA | |||
| Add/Edit RoleInTest | x | NA | NA | NA | |||
| Add / Edit metaTest | x | NA | NA | NA | |||
| Add / Edit path | x | NA | NA | NA | |||
| Copy a test | x | ||||||
| Print a test | x | x | x | x | |||
| Technical Framework Management | |||||||
| Add / Edit Domain | x | NA | NA | NA | |||
| Add / Edit Integration Profile | x | NA | NA | NA | |||
| Add / Edit Actor | x | NA | NA | NA | |||
| Add / Edit Options | x | NA | NA | NA | |||
| Add / Edit Transaction | x | NA | NA | NA | |||
| Add Transaction Option Types | x | NA | NA | NA | |||
| Add/Edit Message Profiles | x | NA | NA | NA | |||
| Add/Edit documents | |||||||
| Link documents to TF concepts | |||||||
| Sample definition management | |||||||
| Add / Edit ObjectType | x | ||||||
| Add / Edit ObjectFileType | x | ||||||
| Certificates | |||||||
| Access certificates page | |||||||
| Pre-connectathon tests | |||||||
| List Pre-CAT Tests | |||||||
| Add logs | |||||||
| Consult test logs | |||||||
| Change status | |||||||
| Demonstration Management | |||||||
| Create demo | x | ||||||
| Edit demo | x | ||||||
| Delete demo | x | ||||||
| View demo | x | x | x | x | x | x | |
| Testing session Management | |||||||
| Create Testing Session | x | ||||||
| Edit Testing Session | x | ||||||
| Delete Testing Session | x | ||||||
| View Testing Session | x | x | x | x | x | x | |
| List Testing Session | |||||||
| Activate/Deactivate Testing Session | |||||||
| Samples | |||||||
| Create/Edit sample | |||||||
| View samples | |||||||
| Upload samples | |||||||
| Validate samples | |||||||
| Update status | |||||||
| Search for samples | |||||||
| Generate connectathon report | |||||||
| Download Systems summary | x | x | |||||
| Patient Demographics | |||||||
| Create a new patient | x | x | x | x | x | x | |
| List patients | x | x | x | x | x | x | |
| Edit patient | x | x | x | x | x | x | |
| Delete patient | x | x (only the ones he/she created) | x (only the ones he/she created) | x (only the ones he/she created) | x (only the ones he/she created) | x (only the ones he/she created) | |
| Share patient | x | x | x | x | x | x | |
| List sharing logs | x | x | x | x | x | x | |
| Add/Edit assigning authorities | x | ||||||
| Link systems to authority | x | x | x | x | x | x | |
| Create patient (admin part) | x |
 Edit users
To edit a user, you have to click on the edit button
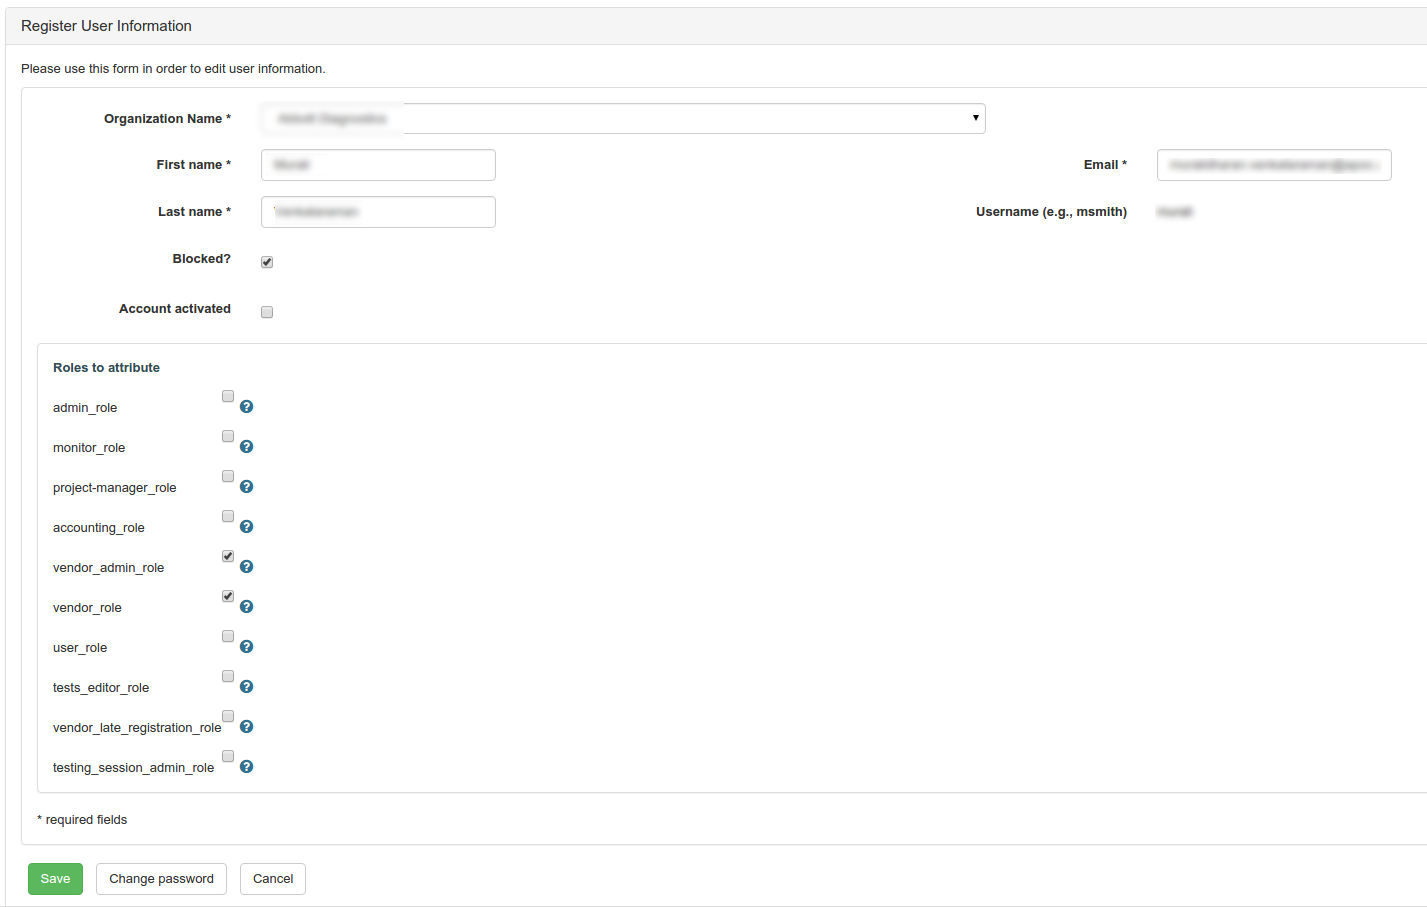
The edit page contains the same information as the add user page, with the possibility to change the password for a user, using the button “change password”
View users
To view user information, admin shall click on the button
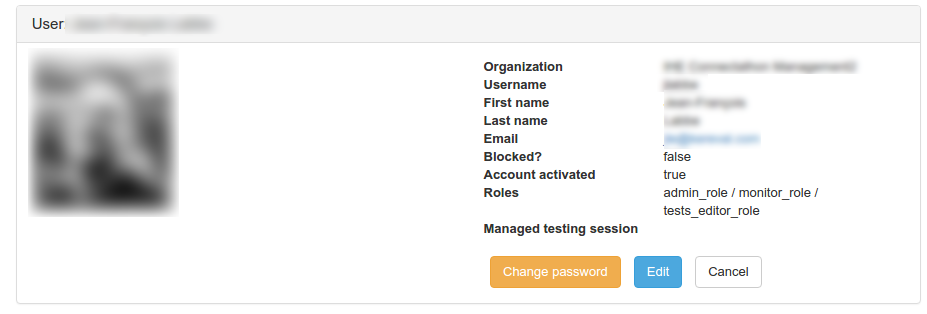
The information provided is the same as in the edition mode
Connect as user
Gazelle offers the possibility to the admin to view the GUI of the vendor, the same GUI configuration, and to connect as the corresponding user; which could be useful when the vendor has a problem, and the admin want to see what it really looks like.
View user preferences
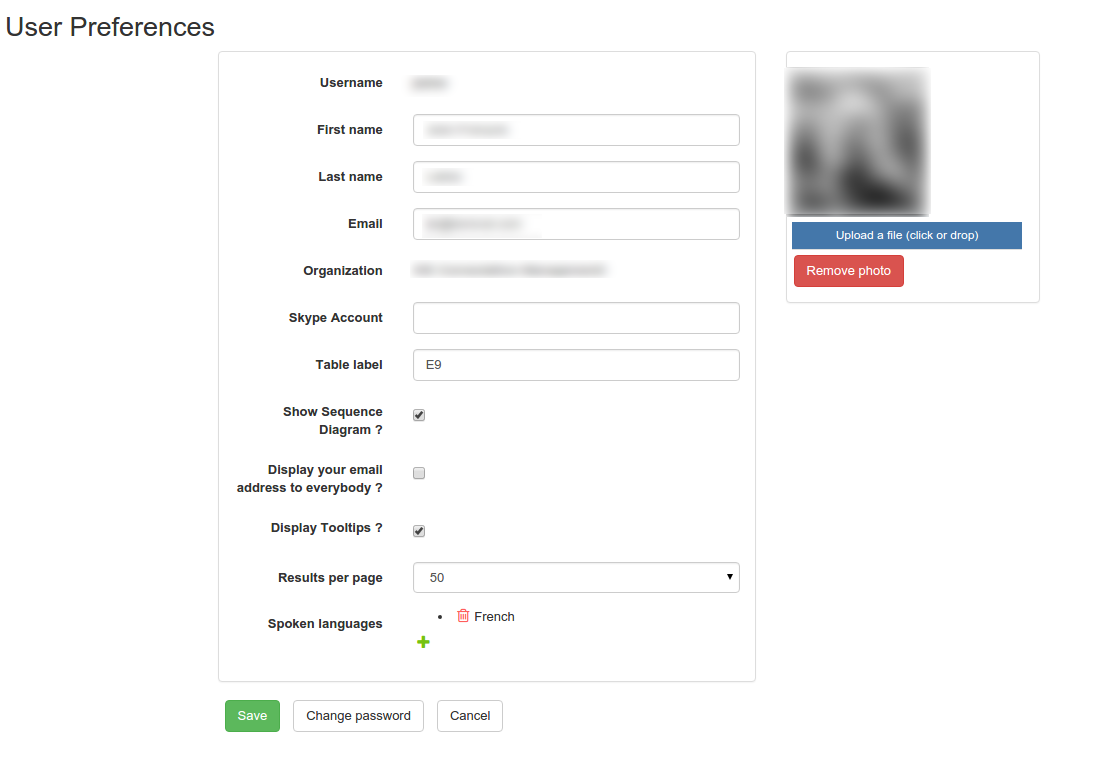
The admin is able to view the user preferences, regarding gazelle use, which are:
- user name
- first name
- last name
- organization
- Skype account
- table label : the table used in a current testing session CAT
- show sequence diagram: this enable or disable the use of sequence diagram under test plan and test instances, may be important for performance issues
- Display your email address to everybody ? : for security issue we added this optionality
- Display Tool tips ? : a number of tool tip are disabled when user want it
- Results per page : the number of result found by page of search, largely used in seach pages (like for test plan , etc.)
- Spoken languages : the list of spoken languages ( useful in CAT)
- user’s picture
Companies/Organizations administration
The administrator has the possibility to edit Administrations registered into gazelle, or to add new organization/companies.
The information related to each organization of this page are scoped to the selected testing session. They can be different if the testing session changes.
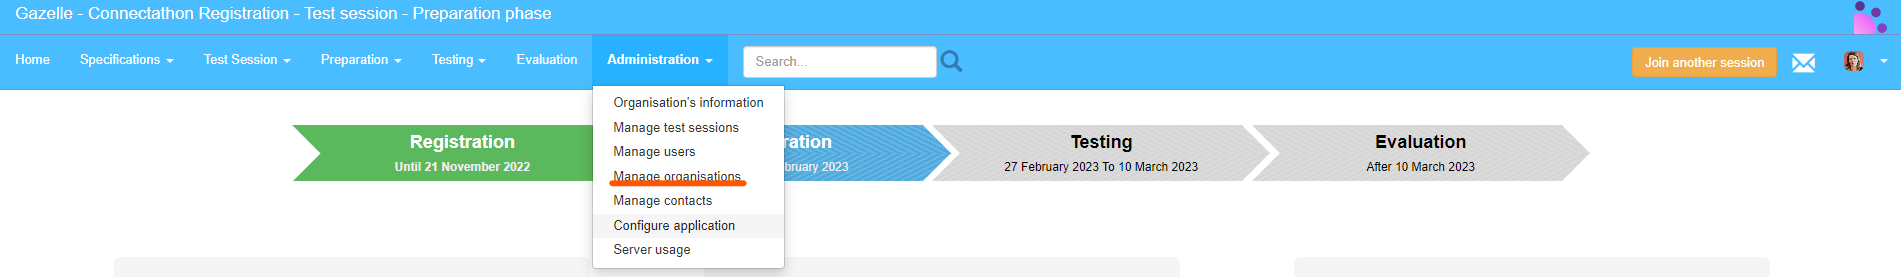
To do so, the admin shall go to menu Administration → Manage Organisations.
The page of this module looks like this:
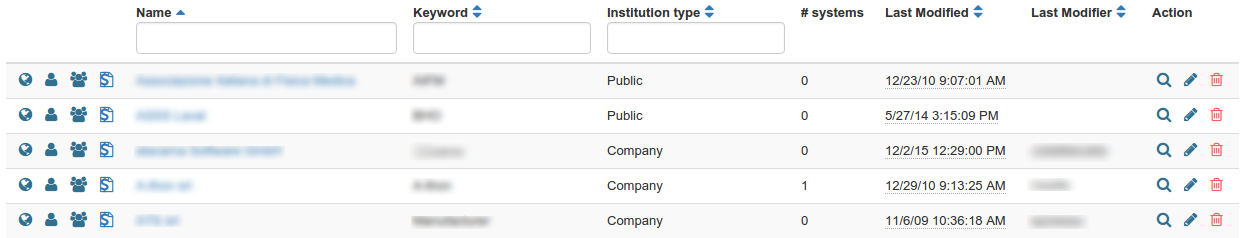
For each organization, we can go to :
- its website
- the list of users related
- the list of contacts related
- the invoice of the institution
The table describes the information related to the institutions: the name, the keyword; the type, the number of related systems, the last modifier and the last modified time. The administrator has the possibility to view, edit or delete an institution.
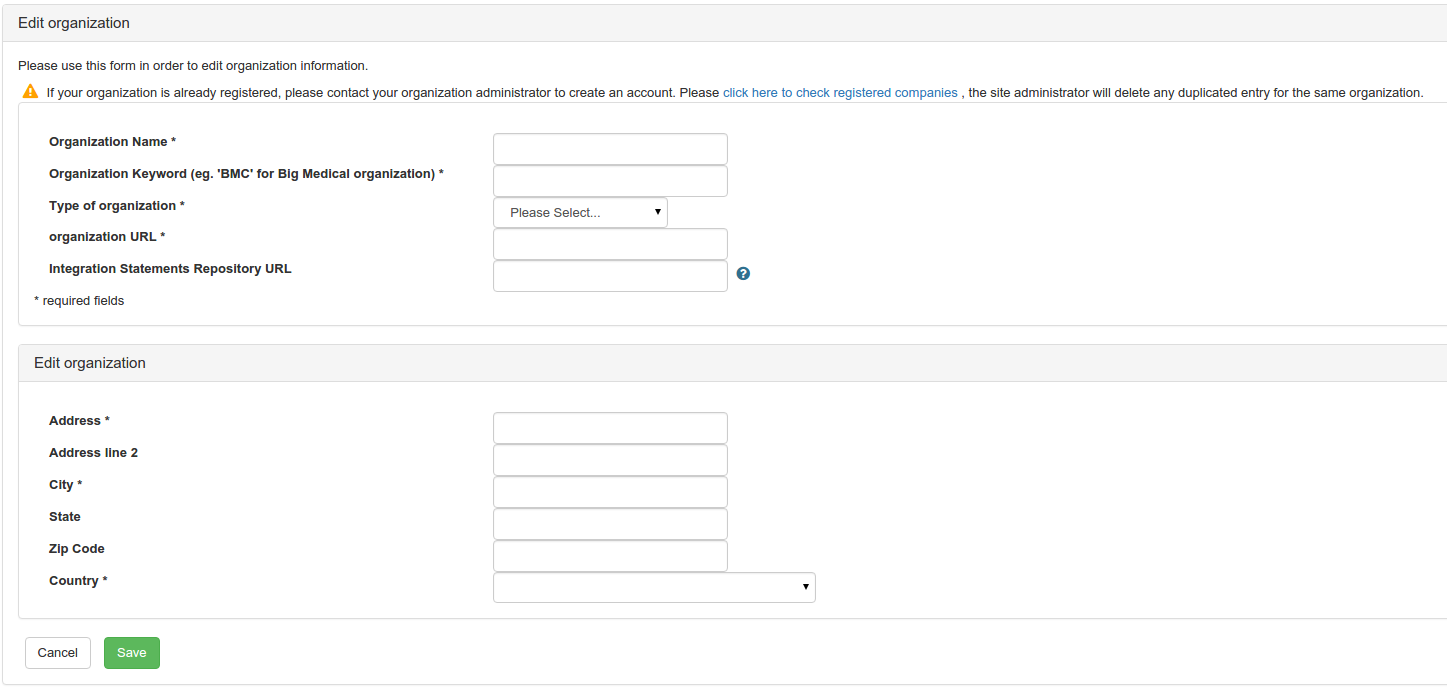
Create New Organization
The administrator is able to create a new administration using the button “Add an organization”.
The result of clicking on this button is the organization edit page:
View Mode
The view mode is possible using the magnifying glass button.
The result of this page is a html description of all the information related to the institution:
- Organization Demographic Summary
- Mailing address
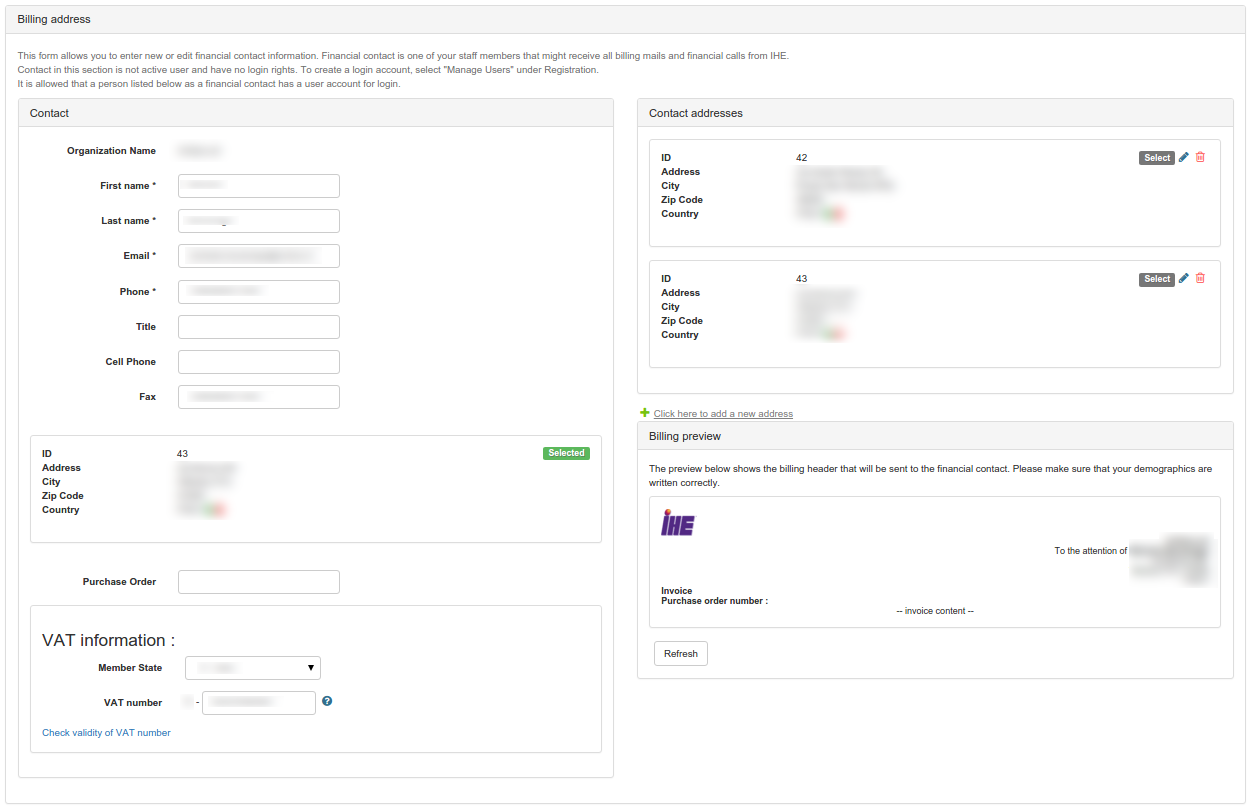
- The billing address
Edit Mode
the Edit mode is shown using the button
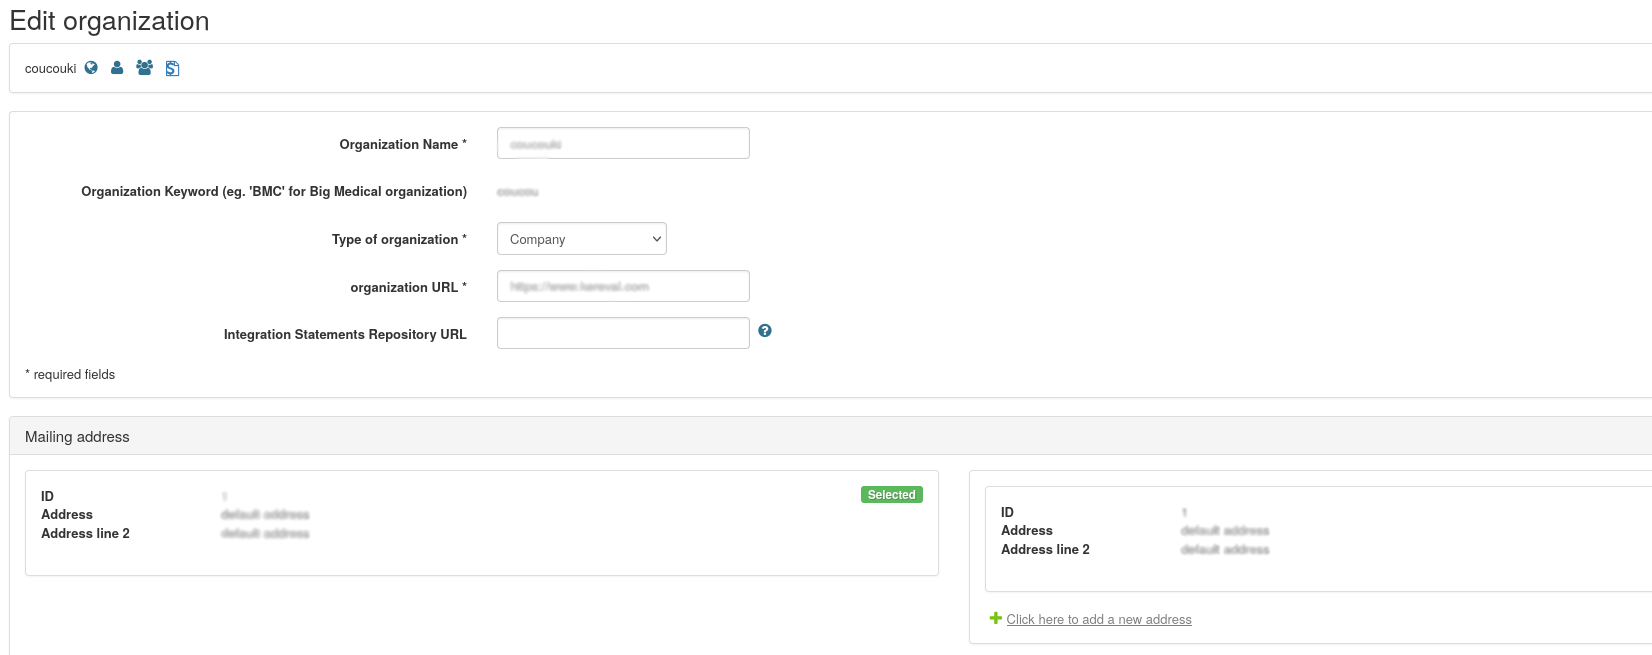
The result of this page is the same rendering for the vendor who creates the organization, but the keyword is in read only, and it looks like this:
Contacts Administration
The admin of gazelle TM can access to the list of contact of organizations, modify, delete or add new ones.
To access the administration of contacts, the admin shall go from the menu to administration -> Manage Contacts.
The main page looks like this:

The button “Add a contact” allows to add a new contact.
The table describes the information related to contacts registred, and we can filter by organization.
The contacts displayed can be edited or deleted, as a vendor admin can do.
Systems administration
Systems are the SUTs (systems under test) registered to a particular testing session. They are identified by a unique keyword and lists all the SUT capabilities the vendor wants to test in the current testing session.
SUTs have a registration status among: In progress, Completed, or Dropped; as well as an acceptance status (Yes/No). Only accepted SUTs will have their test plan generated and will appear as available partners for test cases.
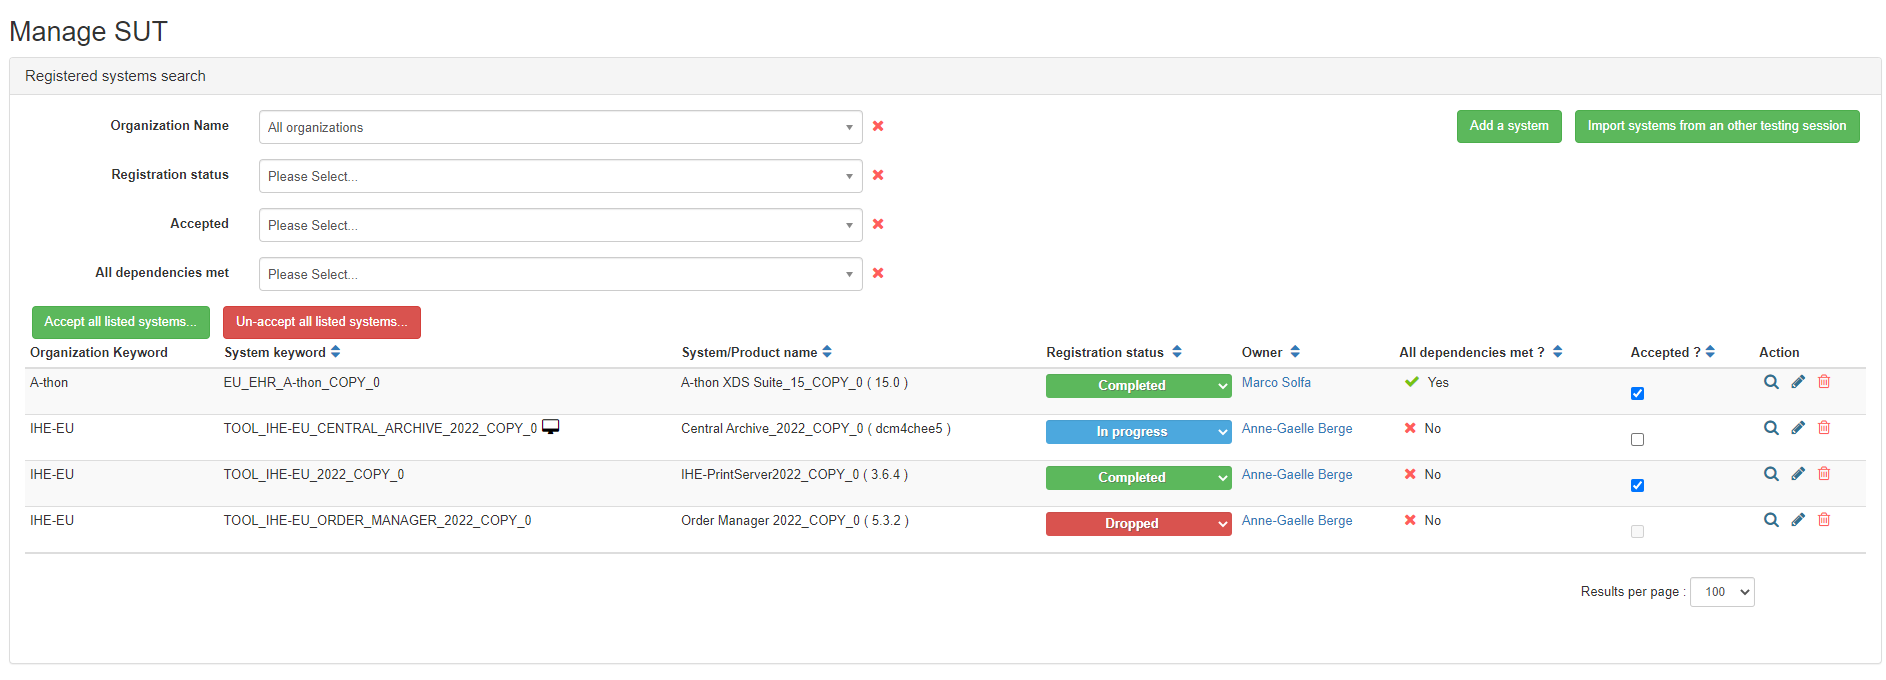
Manage SUTs
The manage SUTs page allows the test session manager to access the list of all the systems under test registered to a testing session along with the following details:
- Whether it is a SUT or a testing tool;
- Its registration status (editable);
- Whether the system is accepted or not (editable);
- Whether all the dependencies are met or not.
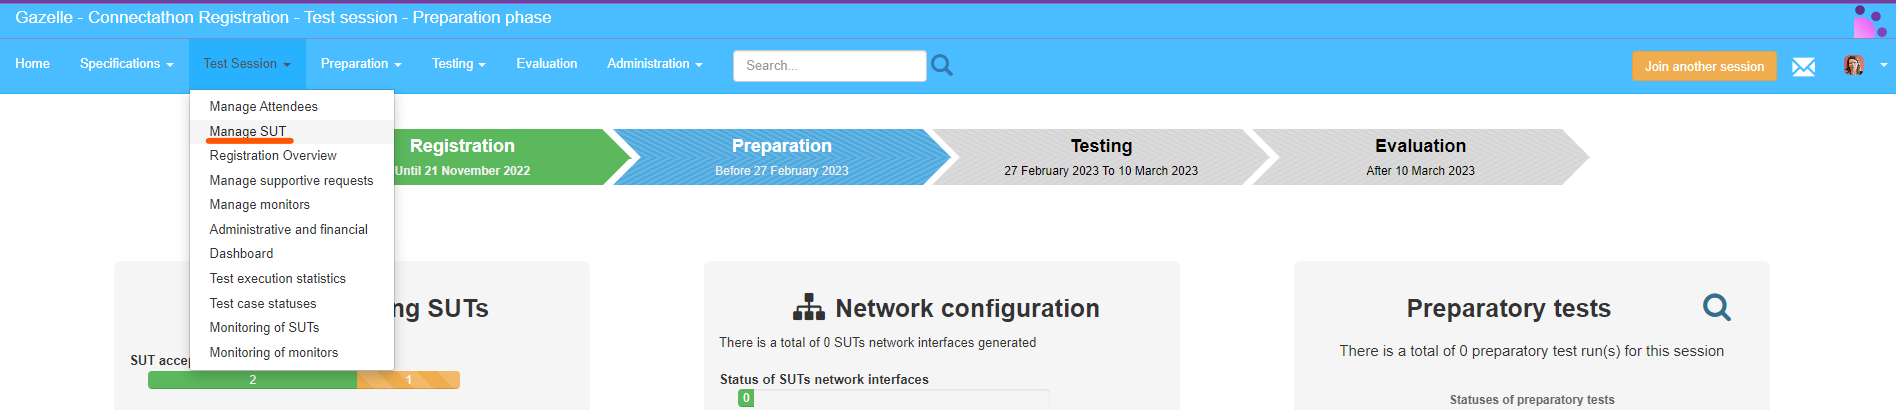
To go to this page, from the menu Test Session -> Manage SUTs.
Add systems
The testing session manager is able to add new system to gazelle TM for the current testing session, by clicking on the button “add a system” ![] (./media/add_system.png)
Import Systems
The testing session manager is able to import systems from other testing session, by clicking on the button “Import systems from another testing session”. This feature only allows to import SUTs registered as part of the user’s organisation. There is no way for the testing session manager to import a systems under test owned by a participating organisation.
Edit Systems

The admin is able to edit information related to existing system in the current session. The information related to the system are:
- system summary (org, name, etc)
- Profiles/actors registred for
- Information related to the session
- demonstrations registred for
- admin information system
- notes (text area)
View Systems
The admin is able to view information related to systems by clicking on the magnifying glass icon.
Manage supportive requests
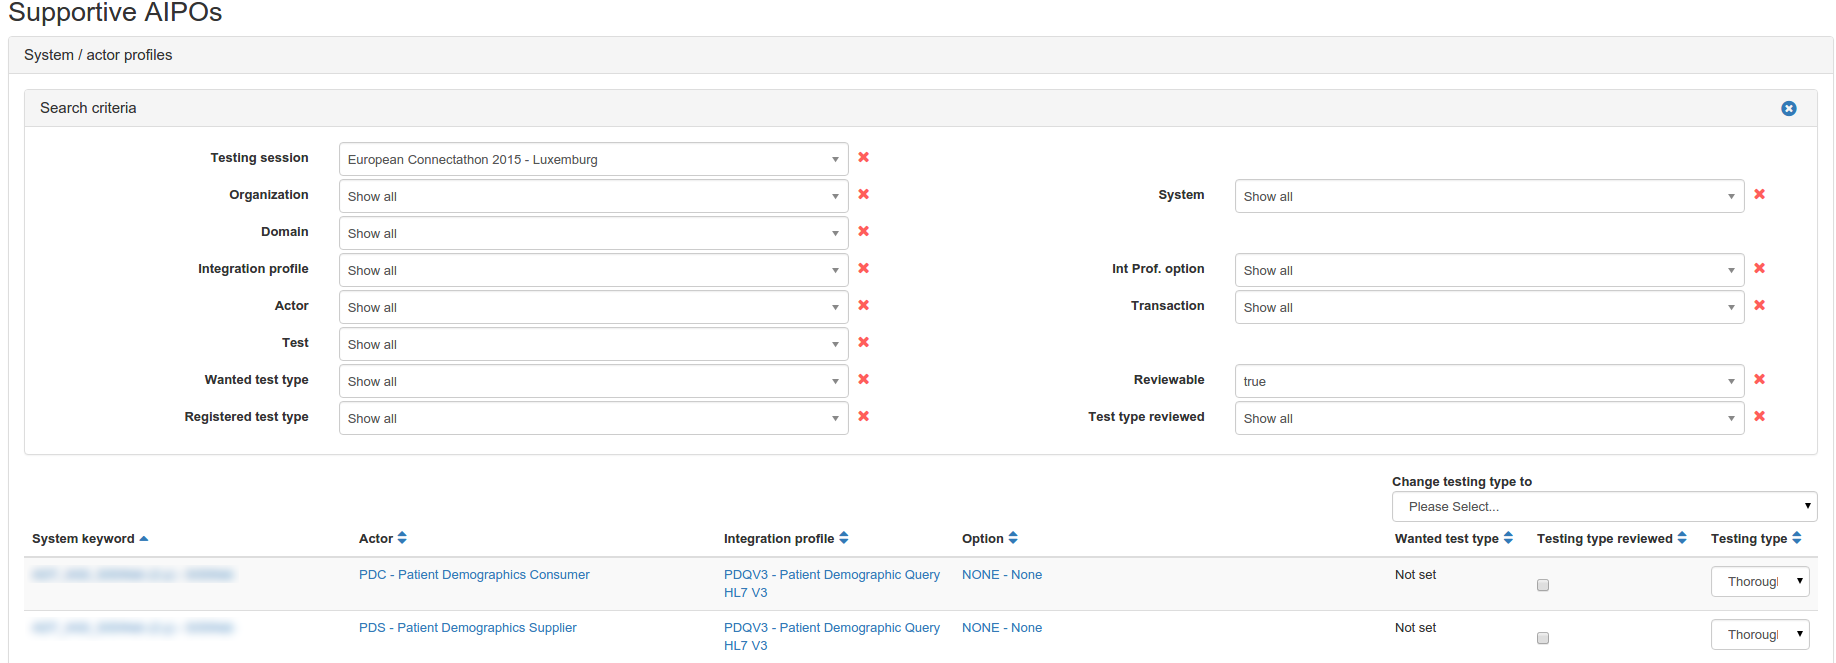
This is the page where admin or testing session manager can grant testing session participating system the ability to participate as “supportive” with a selected list of actor/profiles. This is called testing depth.
It is not our purpose here to describe what supportive and thorough testing mean. For more information please visit this link
Access this feature from Test Session > Manage supportive requests.
The page offers the ability to use filters in order to get the system information, and is able to set to supportive or to thorough all the systems filtered.
Please also note that it is possible to set the value of the testing depth by using the select on the top right of the table. All the entries in the table will then be set in a single click (no confirmation pop-up).
Scope of the testing session
When the testing session manager creates a new testing session, he is asked to list all the Profiles that are offered for the participants to register there SUTs for. Usually, not all the Profiles gather enough participants for testing. In that case, the testing session manager wants to inform the participants which profiles will be tested and which one shall be dropped.
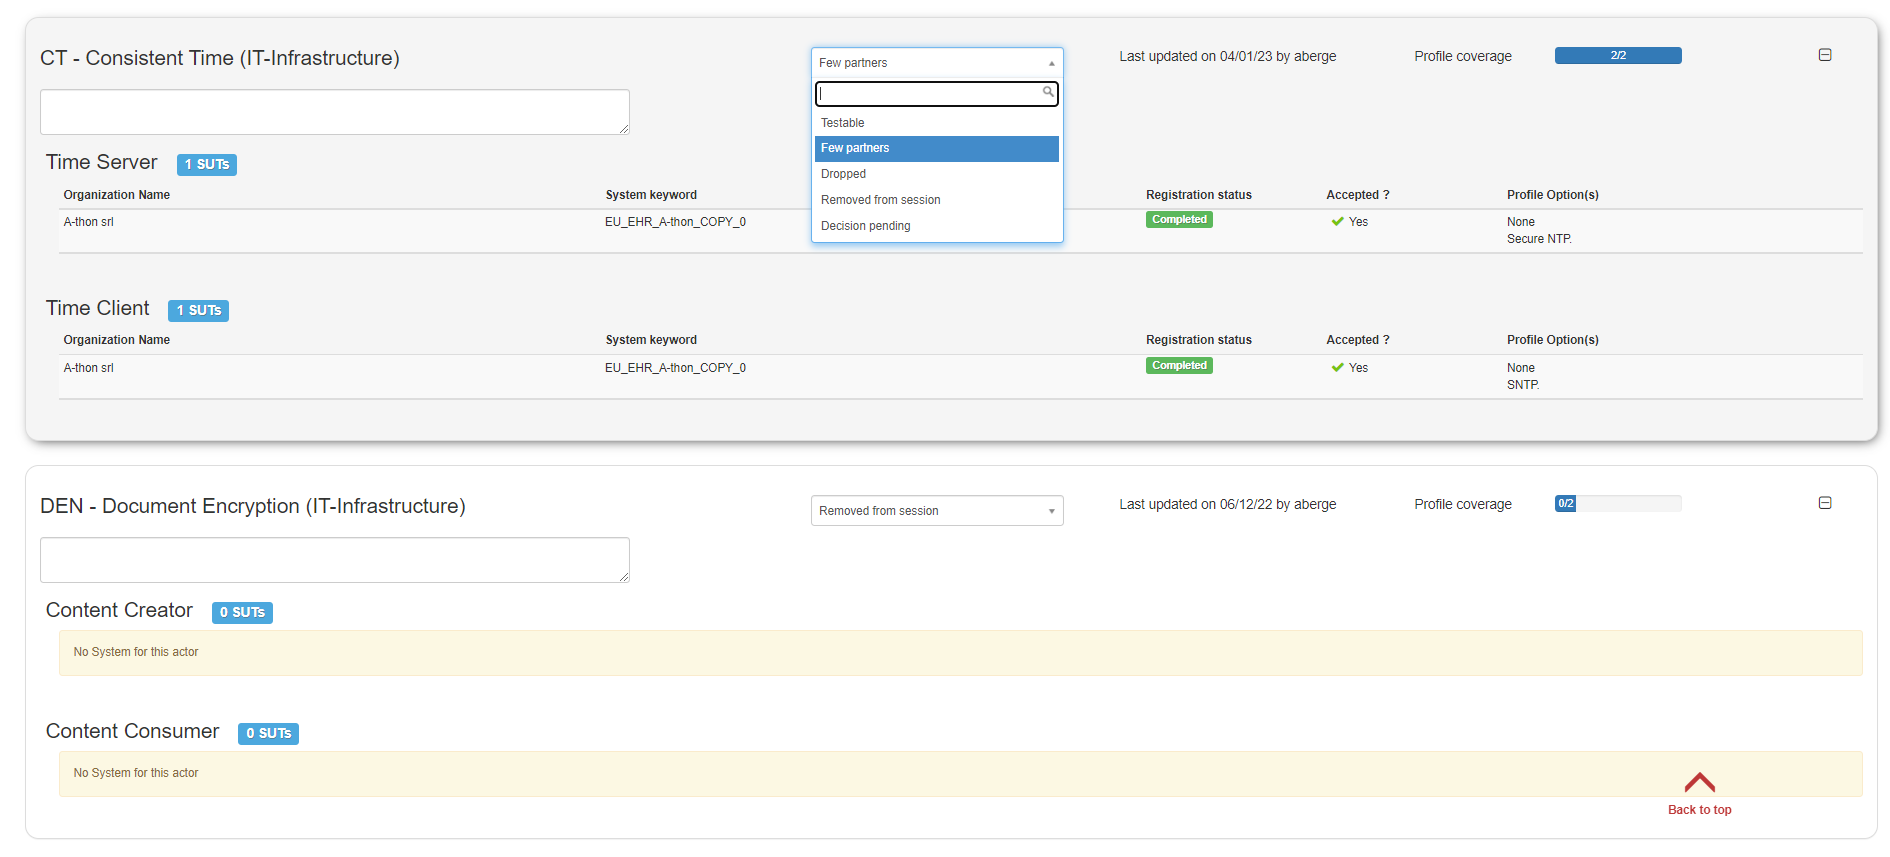
From Gazelle Test Management 6.10.0, a new feature allows the testing session manager to give a “testability” status to every profile selected in the testing session. The Registration overview feature is still available and offers download capabilities.
Managing the testing session scope in Gazelle Test Management
This feature is available under Testing > Testing session scope because it is also available to the monitors and participants (with restricted data).
Each time the testing session object is edited, the tool updates the testing session scope with the list of Profiles available in the testing session:
- If a profile is new in the testing session, it is added and its status set to “Decision pending”;
- If a profile is present in the testing session scope but is no more selected in the testing session, its status is set to “Removed from session”.
- The three other statuses: Testable, Few partners, and Dropped have to be set manually.
When the status of a profile changes, the username of the user who performs the change, as well as the timestamp are logged. Testing session managers are allowed to input comments for each profile. Those comments are public (any logged in user can read it).
For each Profile, the coverage is computed. It indicates how many of the actors defined in the profile have at least one system signed up for it, and how many actors are defined by the profile.
The + icon in the top-right corner of the panel allows to unfold the panel and thus display the list of systems under test that have signed up for each actor along with the list of Profile Options they implement, and the SUT registration and acceptance statuses. Those two last columns are not shown to the monitors and participants.
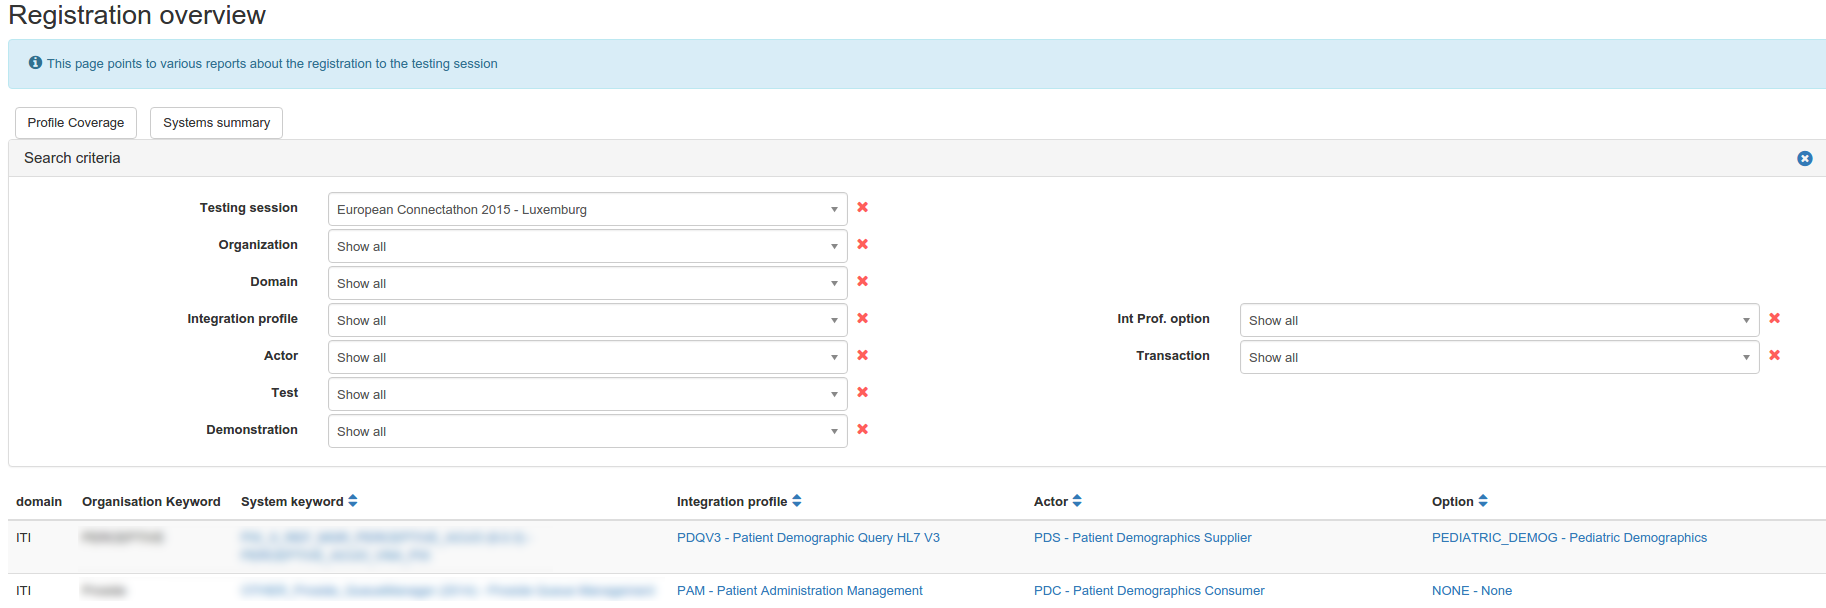
Registration overview
The registration overview allows the admin to view the list of profiles and actors by system.
The admin is able to download the coverage of the profiles by systems, and to download the systems summary regarding the profiles.
This help the admin to know which profile/option has missing partners, and what actions should be taken in accordance to this information.
To go to this page, the admin shall go to: Test Session → Registration Overview
Administration of Testing Sessions
A testing session in Gazelle Test Management is used to manage a testing event. It can be a Connectathon, an accredited testing session, a projectathon or even a virtual testing session. Users registered in the application will be able to create new system for a testing session in particular or to import systems from other events.
The tool is able to manage several sessions at the same time; each session can have a different status.
Accessing the testing sessions
Management of sessions is performed from menu Administration → Manage test sessions.
The first page you access to list the testing sessions registered in your instance of Gazelle Test Management. The highlighted one (bold font) is the testing session you are currently logged into.
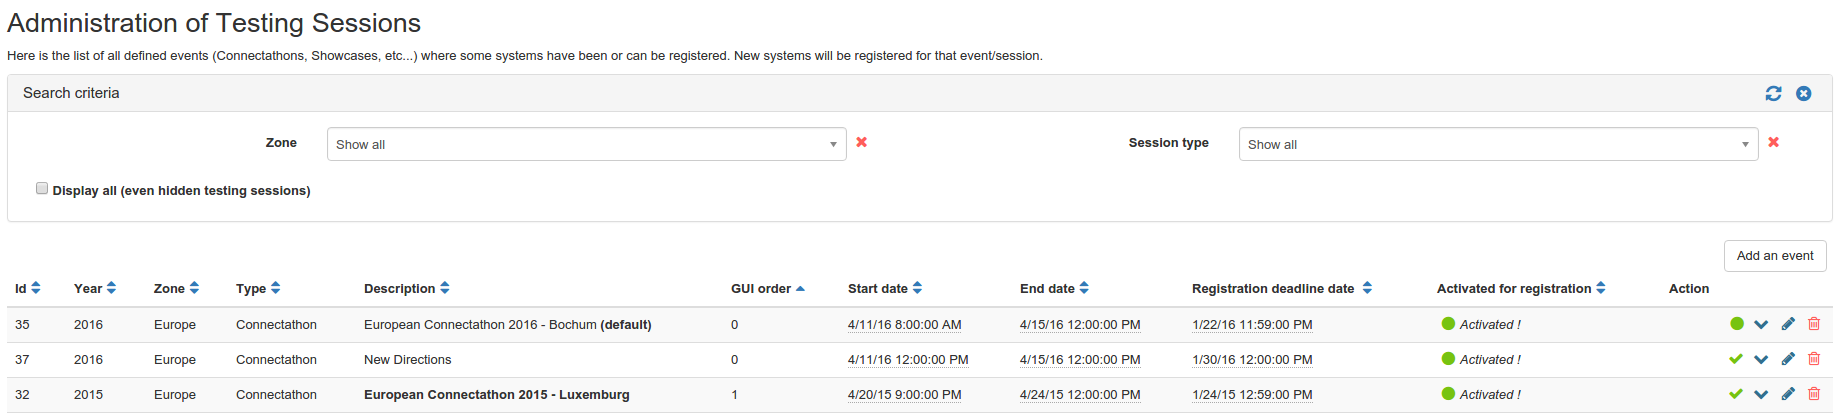
From this page, you can see what are the active testing sessions, active/inactive them, edit them or event delete them. You can also, by clicking on the green tick, set the one which will be used as default when a new user creates an account. Note that logged in user will also be able to acess the activated testing sessions; the other ones will be hidden from the list.
Creating a new testing session
From the Administration of testing sessions page, click on “Add an event”; a new form will be displayed. The following information are requested
- Name : will be used as title of the testing session, it’s unique and mandatory
- Description : optionally describe the testing session
- Start date : beginning of the testing event itself
- End date : end of the testing event
- Registration deadline : after this date, users will not be able to alter their system (addition/removal of actor/profile)
- Mailing list URL and wiki URL are given for informational purpose only
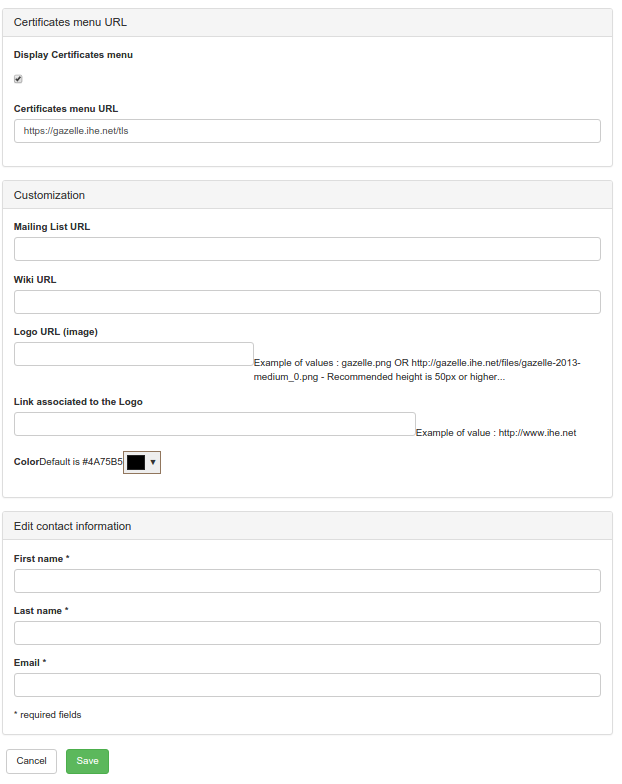
- Logo URL : can be the link to an image in the tool (/img/gazelle.gif for instance) or an external link. It will be displayed in the right of the page when this testing session is selected by the user)
- Link associated to the logo : when clicking on the logo, user will be redirected to that page
- Colour: theme of Test Management can be customised and the background colour can be different for each testing event. Note that the colour of the text will not change, so be careful to use a colour which will still allow the reading of the application
- Order in GUI : used to order the testing session in the pop-up used to change the current testing session of the logged in user
Then you can select several options :
- Default Testing Session : If this event the default one for new users (Default testing session)
- Enable Pre-connectathon Testing: Is Internet testing enabled (that means that users can enter their SUT endpoints outside of the testing event network)
- Enable Pre-Connectathon Testing : Is pre-connectathon testing requested (users will be expected to perform some in-house tests before showing up at the event)
- Allow Same Company Testing : If this is checked, starting a test instance with 2 systems from the same company is possible for every one. If not checked, then only a user with the role admin or the role Testing Session manager can start it. This is a mean to enforce the rule in a testing session.
- Allow Participant Registration :Is Gazelle Test Management used to manage the badges (Allow Participant registration)
- Hidden from list* : if checked, users will not be able to select this testing session
- Critical Status : At some point during the event, you may want users to highlight the test instances they really need; enabling the critical status will allow users to mark some test instances as critical and will then be checked in priority by monitors
- Session closed : if the testing event is closed, users will not be able to create new test instances nor alter others
- Disable auto update result : the Connectathon results are periodically computed, you can disable it for a testing session. Note that you might not want to disable it until a testing event is running since it will also prevent the tool from creating the test plan of the systems.
- Disable patient generation and sharing : If checked, the functionality of patient generation and sharing is not enabled for the edited testing session
Then you can select a set of test types to be added to the test plan generated for every SUT.
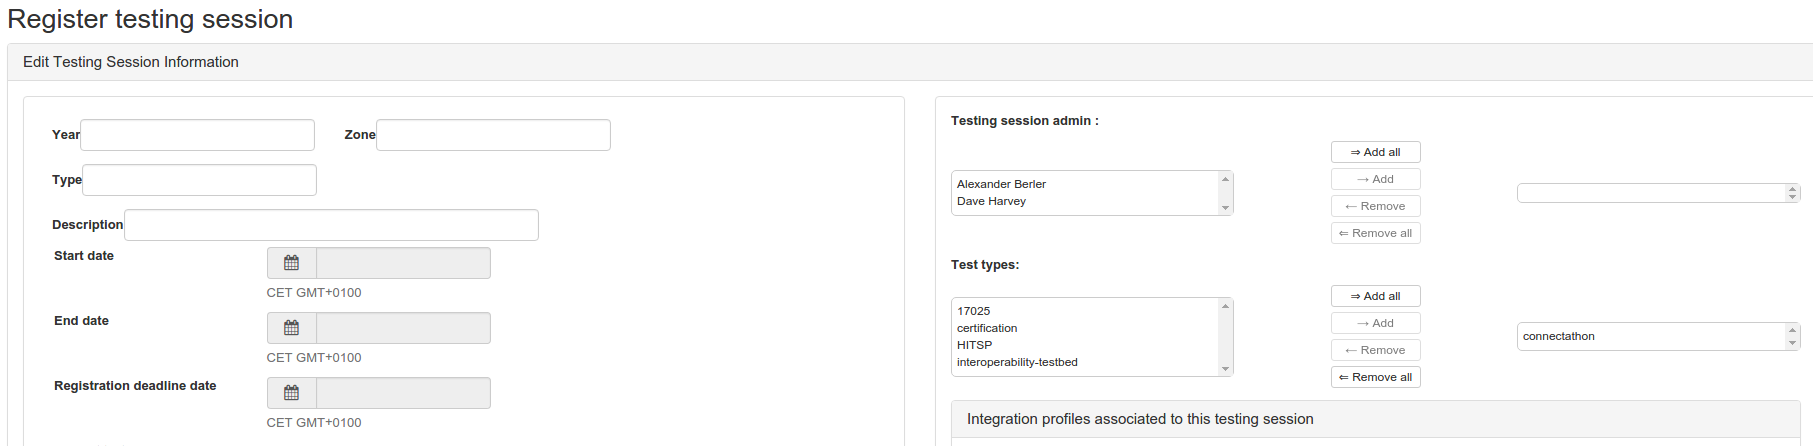
The testing session administrators are used in the header of the test reports
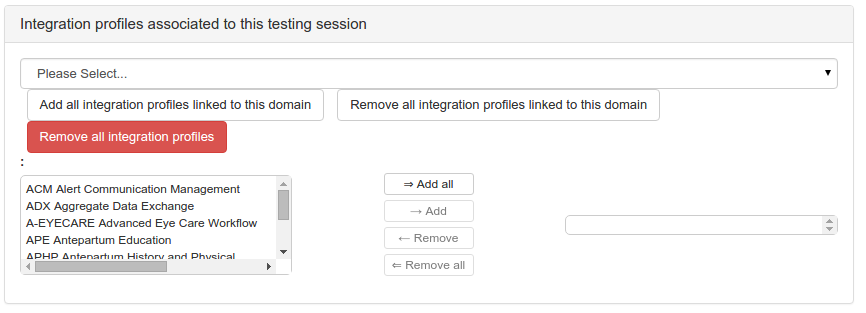
Then, pick up the integration profiles for which the users will be allowed to register their systems.
Contact information
Here you need to give information about the person to contact for questions about the event. Those details will be used to generate the test session report.
Certificates menu URL
Depending of the events, the management of certificates is not performed by the same tool. If you want users to share certificates using a specific tool, tick the “Display certificates menu” check box and enter the URL of the tool.
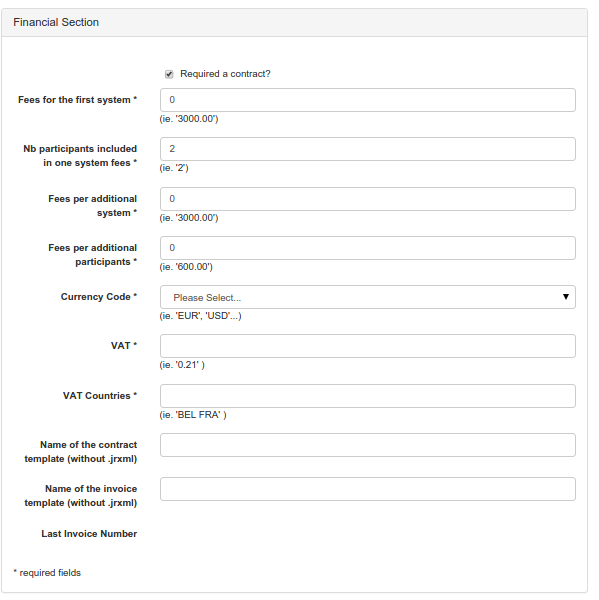
Financial section
Gazelle Test Management can generate the contract and the invoice, if this testing event requires a contract and you want the tool to manage it, tick the check box “Required a contract ?”.
Note that the rule for computing fees currently applies in Gazelle Test Management is the following:
For systems: the amount is relative to the number of systems the company has registered, and marked “completed”. You can state that the price for the first system is different from the one for the followings. For attendees: you can define that the price for each system includes X attendees, and what is the price for each additional attendees.
Currency code is used to express the currency to be used (ex: EUR).
You can define the amount of VAT (between 0 and 1, 20% would then be 0.20). The list of “VAT countries” is used to apply the VAT to organisation who are registered in a country from that list.
Finally, the contract and the invoice are generated based on a Jasper report, you need to provide the location of those *.jrxml files.
Testing management
From this point, you can randomly generate test instances for testing the tool. You can also delete all the test instances to reset the testing session.
Administrative and financial page
This feature is available from Test Session > Administrative and Financial.
button “generate invoice”: generate a pdf invoice of the selected invoice and save it on the /opt/gazelle/data/CAT<%session_year%>-<%invoiceNumber%>.pdf. If the vendor has already download a contract, we verify if the new generated invoice concord to the latest update contract by the vendor, if there are difference, a warning will appear in financial summary.
button “Reload Invoice”: If the current invoice was sent to institution, attributes of this fees are not updated if vendors add/remove participants or systems. So what we see does not correspond to what the vendor shall pay but it correspond to what the vendor will pay for the invoice sent by the administrator of gazelle. To update the invoice you have to click on the button “Reload Invoice”. nb : the invoice pdf is not regenerated after clicking on the button “reload invoice”. If after reloading, the last contract generated by the vendor is out of date, a warning will appear on the financial summary.
button “Recalculate fees”: If the number of systems, or the number of participants was modified manually by administrator, to update fees you have to click on the button recalculate fees. This button is here to add the possibility to the administrator to fix manually what the vendor shall pay. So here, the feesAmount is calculated from the number of system and the number of participant that the administrator was specified on the edition of the invoice. nb : the invoice pdf is not regenerated after clicking on the button “Recalculate fees”. If after reloading, the last contract generated by the vendor is out of date, a warning will appear on the financial summary of the vendor.
button “Update”: this button save the modification done by the administrator, if the contract received date is not null, we suppose that the vendor has received the contract. If after the modification of the invoice and the update, the oldest contract downloaded by vendor is out of date, a warning will appear to the vendor, that he shall reload its contract.
The icon “update Invoice number” (refresh icon): this icon assert to the invoice a new number, and regenerate the invoice pdf on the /opt/gazelle/data/ with the new number. For each session, for each invoice, we have an unique number.
Systems Configurations Administration
The system configuration administration is divided into 4 parts, reachable from the Preparation menu
- Network configuration: details about the test event network
- SUT's nodes : manage the host name and IP addresses assigned to systems under test for the event
- SUT's network interfaces : manage all the configuration of all the systems
- Manage OIDs : manage the OIDs to be used by systems under test during the event
Network Configuration
Before managing the hosts and the system network configurations, you need to configure the network of the testing event. To do this, go to Preparation –> Network configuration. This page is made of three sections materialized by three tabs.
Hosts configuration
This page shows to text area. In the first one, you can give tips to the user regarding the network configuration during the event. We usually provide the Wireless SSID and keys, the subnet information (net mask, gateway, DNS server, internal domain name and so on), the URL of the tools and their IP addresses.
In the second area, you are requested to provide the header of the host file so that people will be able to download a complete host file gathering the host names and addresses of all the systems connected during the Connectathon.
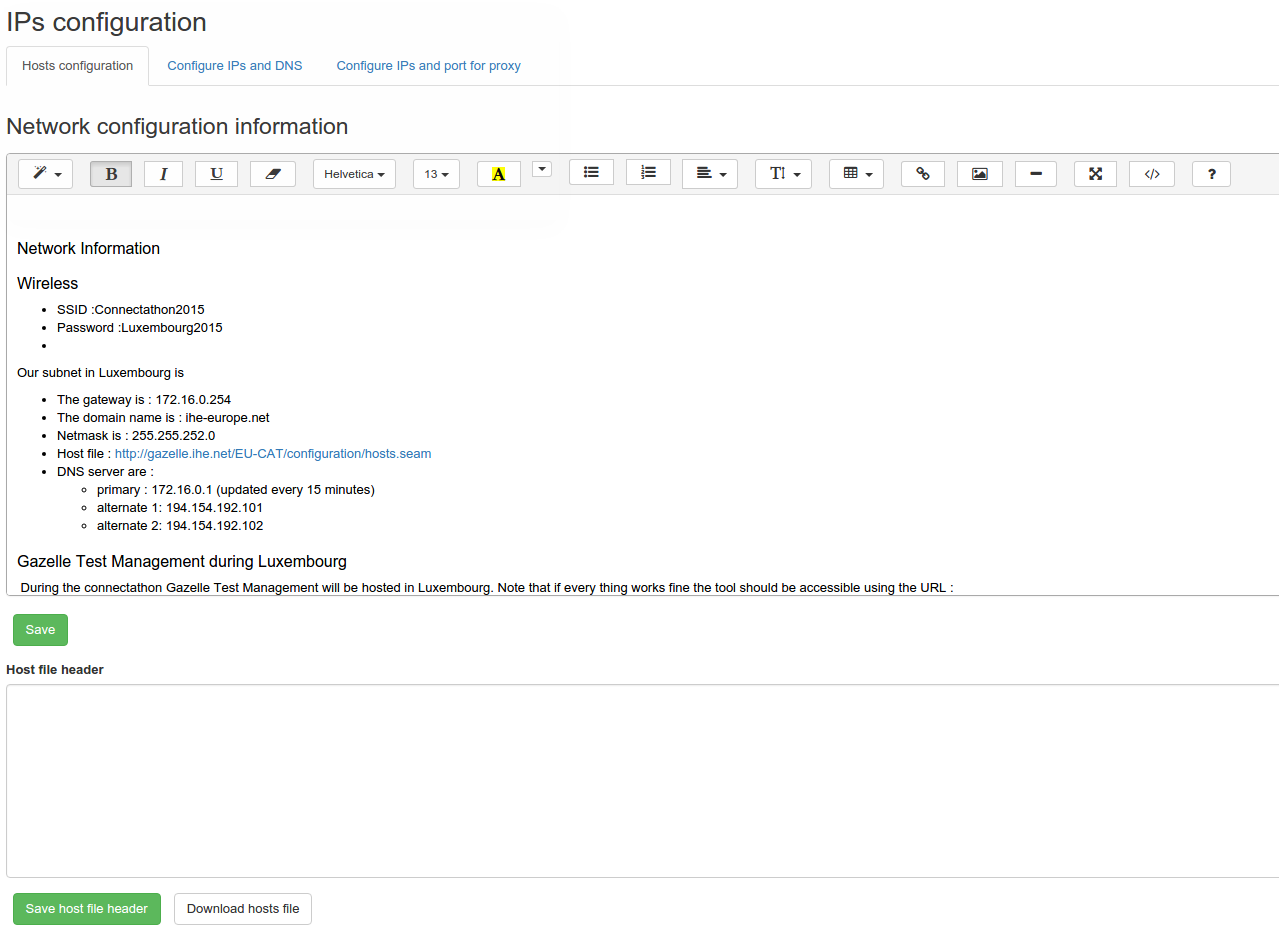
Participants to the testing session who do not want to use DNS can download the host file and use it to configure their system. THIS OPTION IS NOT RECOMMENDED BUT WAS IMPLEMENTED FOR ONE DEVICE THAT COULD NOT USE DNS. DNS IS THE PREFERRED SOLUTION AS IT IS DYNAMIC !
- Configuration of host file on windows system
- Configuration of host file on MacOsX system
- Configuration of host file on Linux system
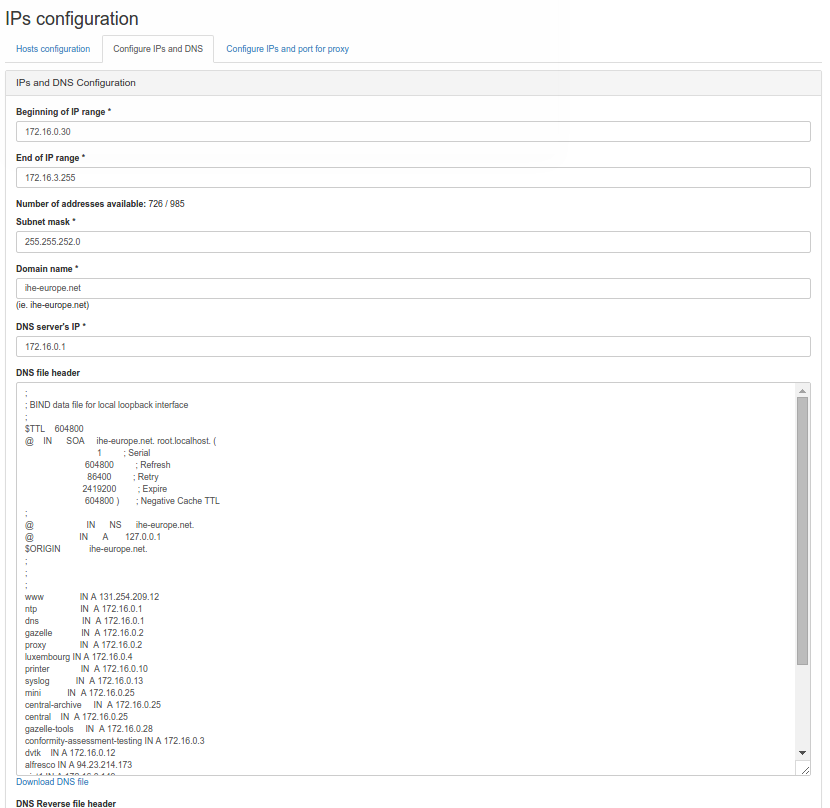
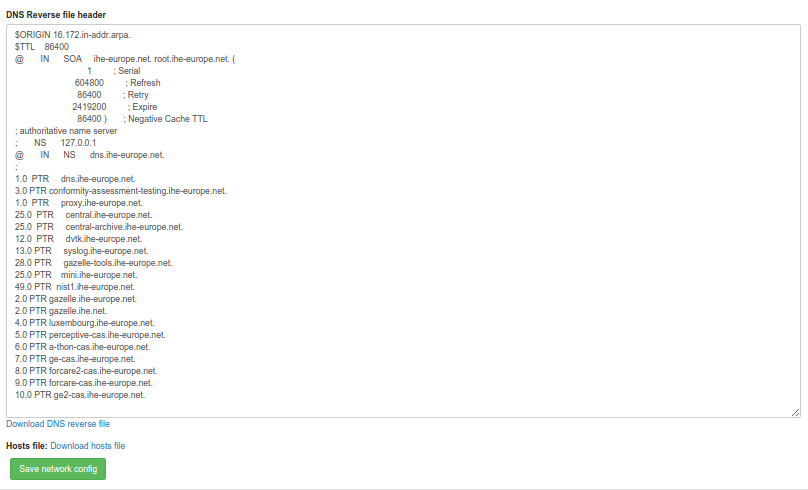
Configure IP and DNS
Filling out those information will help the tool with assigning IP addresses and build the DNS and DNS reverse file.
Example of DNS file header and DNS reverse file header are provided below.
;
; BIND data file for local loopback interface
;
$TTL    604800
@    IN      SOA     ihe-europe.net. root.localhost. (
                              1         ; Serial
                         604800         ; Refresh
                          86400         ; Retry
                        2419200         ; Expire
                         604800 )       ; Negative Cache TTL
;
@                      IN      NS      ihe-europe.net.
@                   IN      A       127.0.0.1
$ORIGIN            ihe-europe.net.
;
;
;
ntp                  IN  A 192.168.0.10
dns                  IN  A 192.168.0.10
ihe-eu0            IN  A 192.168.0.10
gazelle            IN  A 192.168.0.10
proxy              IN  A 192.168.0.10
printer             IN  A 192.168.0.10
syslog           IN  A 192.168.0.13
central-archive     IN  A 192.168.0.11
central    IN  A 192.168.0.11
gazelle-tools     IN  A 192.168.0.13
dvtk    IN A 192.168.0.12
$ORIGIN 168.192.in-addr.arpa.
$TTL    86400
@       IN      SOA     ihe-europe.net. root.ihe-europe.net. (
                              1         ; Serial
                         604800         ; Refresh
                          86400         ; Retry
                        2419200         ; Expire
                          86400 )       ; Negative Cache TTL
; authoritative name server
;       NS      127.0.0.1
@       IN      NS      dns.ihe-europe.net.
;
10.0  PTR     dns.ihe-europe.net.
10.0  PTR     ihe-eu0.ihe-europe.net.
10.0  PTR     proxy.ihe-europe.net.
11.0  PTR     central.ihe-europe.net.
11.0  PTR     central-archive.ihe-europe.net.
12.0  PTR     dvtk.ihe-europe.net.
12.0 PTR     connectathon2014.ihe-europe.net.
13.0 PTR     syslog.ihe-europe.net.
13.0 PTR     gazelle-tools.ihe-europe.net.
DNS automatic configuration on the server
In order to automatically update the DNS configuration on the server that is hosting the Gazelle Test Management application, one need to run the following script update_dns.csh
-
Download the script and place it in the directory /opt/gazelle/dns
-
install bind9 on the server :
apt-get install bind9
You also need to configure bind9 (see documentation) in order to add a new zone that matches the requirement of the network on your session.
In the file /etc/bind/named.conf.local add a line specific to your zone
include "/etc/bind/named.conf.ihe-zones"
Here is an example of the file named.conf.ihe-zones as used at one of our event for illustration. Note that the file makes references to the 2 files created by the update_dns.csh script :
zone "ihe.net" IN {
  type master;
  file "/etc/bind/zones.ihe.net";
  forwarders {
        213.33.99.70;
        };
};


zone "ihe-europe.net" IN {
  type master;
  file "/etc/bind/db.192.168";
  forwarders {
        213.33.99.70;
        };

};
zone "168.192.in-addr.arpa" {
  type master;
  file "/etc/bind/reverse.192.168";
};
Finally edit the script update_dns.csh and configure it in order to match the configuration of your network and the session in use.
Currently the DNS can only be updated for ONE SINGLE testing session.
We recommend to use a cron to automatically update the DNS configuration on the server
*/15 * * * * /opt/gazelle/dns/update_dns.csh
Then SUT can be configured to point to the DNS server that is configured that way.
- Configuration of DNS client on windows system
- Configuration of DNS client on MacOsX system
- Configuration of DNS client on Linux system
Configure IP and port for proxy
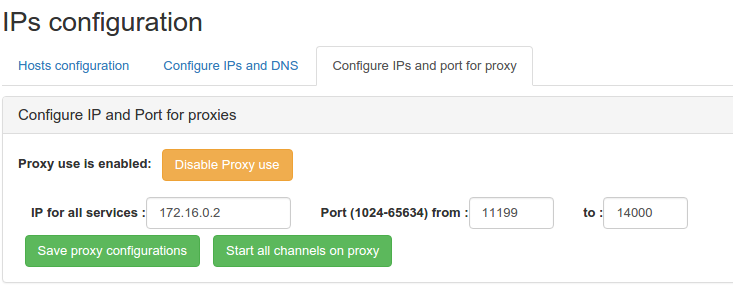
You may have configure the URL of the proxy in the application preferences. However, you might not want to use the Gazelle Proxy tool for all the testing event registered in the tool. From this page, you can enable/disable the use of the proxy during the event. In order to help users with using the Proxy, you are asked to provide the IP address used to contact it.
When generating the system network configurations, if the proxy is enabled, each configuration will have a proxy port assigned. You need to provide the range of port used by the proxy so that the tool knows which values are allowed.
From this page, you can also start all the channels on the proxy; that means that the tool will gather all the system network configuration of receivers and tell the proxy to open the corresponding ports.
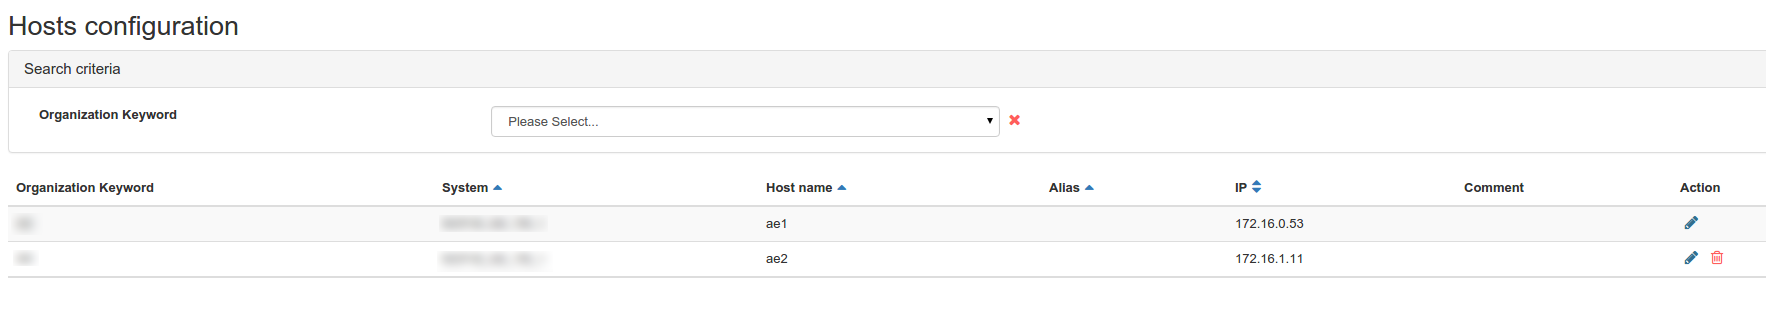
Manage Hosts’ configuration
The list of hosts which is displayed on that page is restricted to the host assigned to the systems from the testing session you are currently logged in. If you need to access the list of hosts for another testing event, you need to change your testing session using the “Join another session” button.
From the SUT's nodes page, you can assign internal IP addresses to all the hosts/systems registered for the testing event or you can even release all the IP addresses. The latter means that for each host defined in this testing session, the IP address will be set to null.
- A host name in Gazelle Test Management has the following attribute
- The system it is assigned to
- The host name
- An alias for this host name
- The assigned IPv4 address
- A comment about its usage
You can edit each host and then get additional options/informations:
- Is the host external to the testing event network
- Assign the next available IP address from the range defined for the event
All configurations
A network system configuration gives information to the user on how to configure their systems for the testing event and how to reach the systems of their partners for testing. Which type of configuration is requested by each actor is defined in Gazelle Master Model.
From menu Preparation > SUT' network interfaces, you will access the list of SUT endpoints generated for the testing session you are currently logged in. From this page, you can edit each entry one by one, approve it (it is usually an action to be performed by the SUT operator) or delete it.
“Add a config” button will allow you to create a new entry in the list for a system registered in the testing session you are currently logged in.
“Generate configs for selected session” will generate all the entries for all the systems registered in the testing session. Note that this task is long and performed in background; you will have to refresh the page latter on to get the list of configurations.
Note that if you select an Organization in the filter available at the top of the page, you will get a button to generate the configurations for all the systems owned by this organization; if you select a system from this same filter, you will get a button to generate the configuration for this specific system.
OIDs management
In some profiles, the messages or the documents described must be populated with OIDs. An Object Identifier shall be unique, it is composed of a root, managed by an authority and the rest manage by the system to which the root is assigned; in order to help vendor to configure their system, Gazelle Test Management offers a feature to manage the OID roots.
From menu Preparation > Manage OIDs, you will access a page divided into four tabs; they are described below:
OID - System assignment
In this tab, you will find the list of OID roots assigned to the systems registered within the tool. You can filter the list by testing session; knowing that the testing session set when you accessed the page is the testing session you are currently logged into.
Note that you can edit those values by clicking on the edit icon.
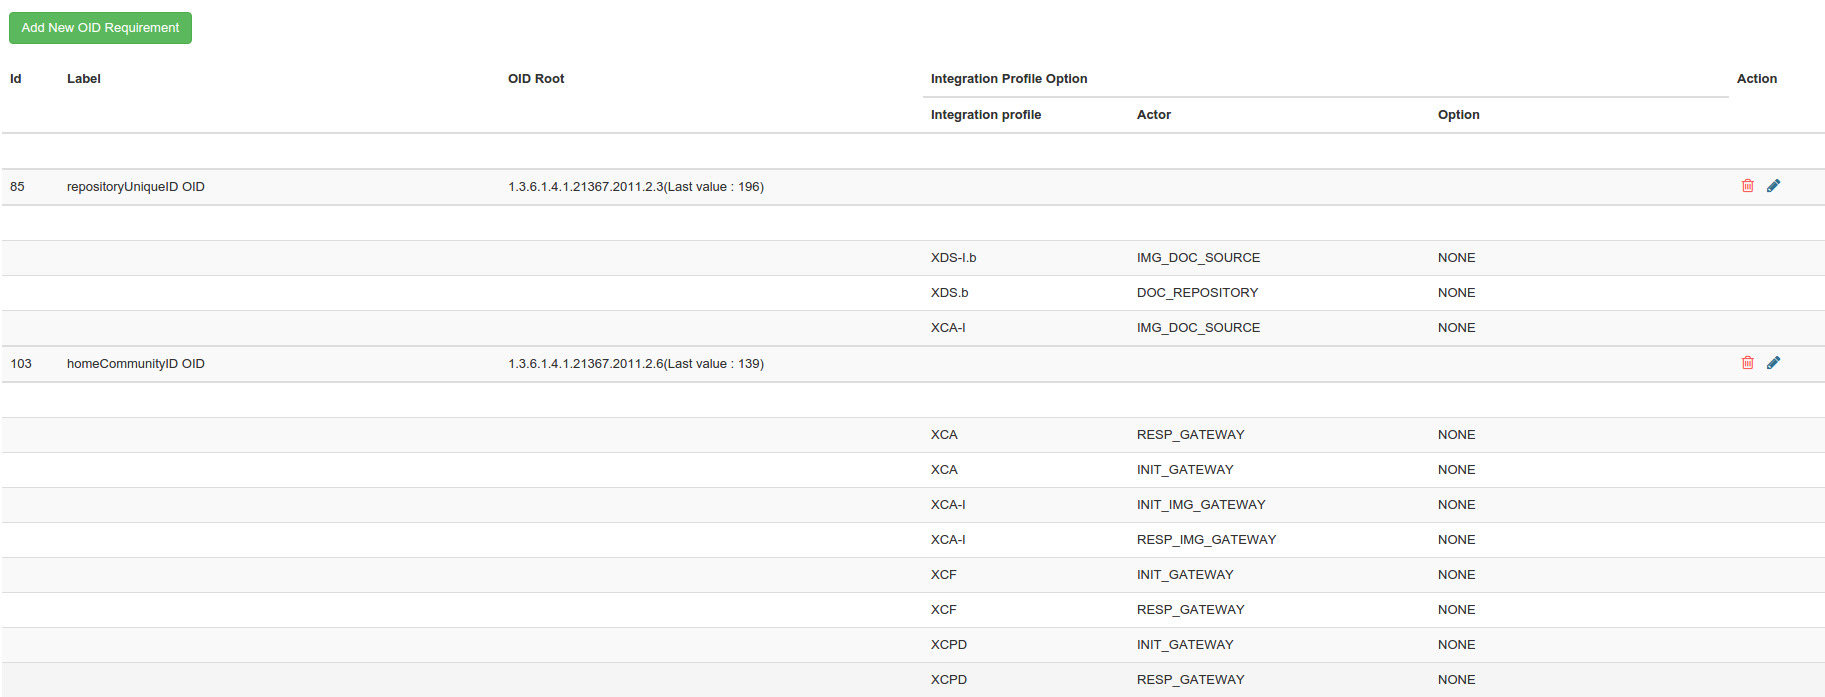
OID requirements
This section allows the administrator of the tool to define for which actors OIDs need to be defined and what this OID will be used for. You can edit, delete or create requirements. Before creating a new requirement, if you intent to use an OID different from the ones already used, first jump to OID Roots tab to define a new OID. Note that those OID requirements are common to all the testing sessions.
When you edit or create a requirement, you are ask to provide the list of Actor/Integration Profile/ Option tuples to which it applies; to do so, use the “add AIPO” button; select your AIPO and click on the “Add new AIPO” button.
You can also remove an AIPO from the list, only click on the red cross in the table on the corresponding line.
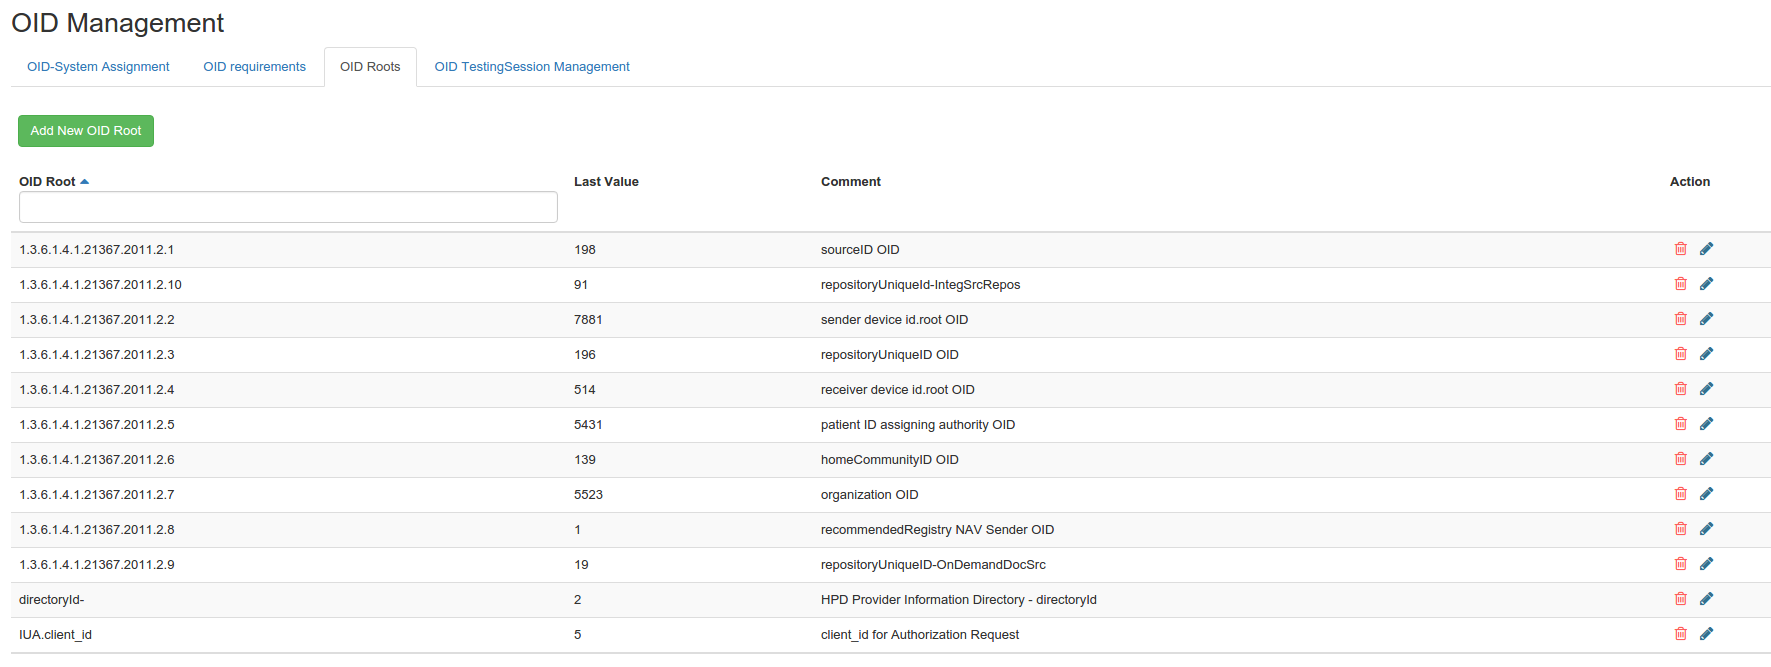
OID Roots
Here are listed all the OID roots which are used to build OIDs; the last value coming from the database is already displayed there. For each root, you can also provide a comment to inform the users what this root is used for.
You can edit and delete root OID, you can also create new ones; only click on the “Add a new OID Root” button and fill out the form which appears in the pop-up. Note that those roots are common to all the testing sessions.
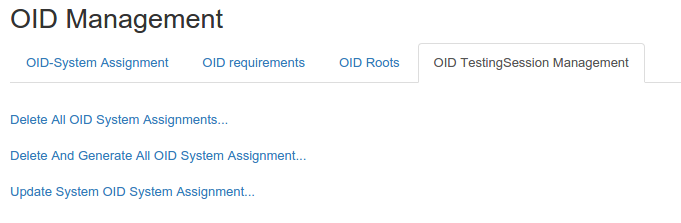
OID Testing Session Management
From this section, you are allowed to perform three actions:
- Removing all the OIDs which have been assigned to the systems registered to the current testing session
- Removing and generating again all the OIDs for the current testing session
- Updating the OIDs assigned to the systems; that means that systems which have been newly added will get OIDs and if no requirements have been creating, they will be applied to the concerning systems.
Samples Administration
Sample Type management
The sample type view mode is accessible for the admin of Gazelle TM when the tool act as Test Management mode, or as master model mode. However, the edition of samples type is accessible only when master model mode is activated.
To access the sample type management, from menu Testing -> Manage samples.
The home page of sample type management looks like
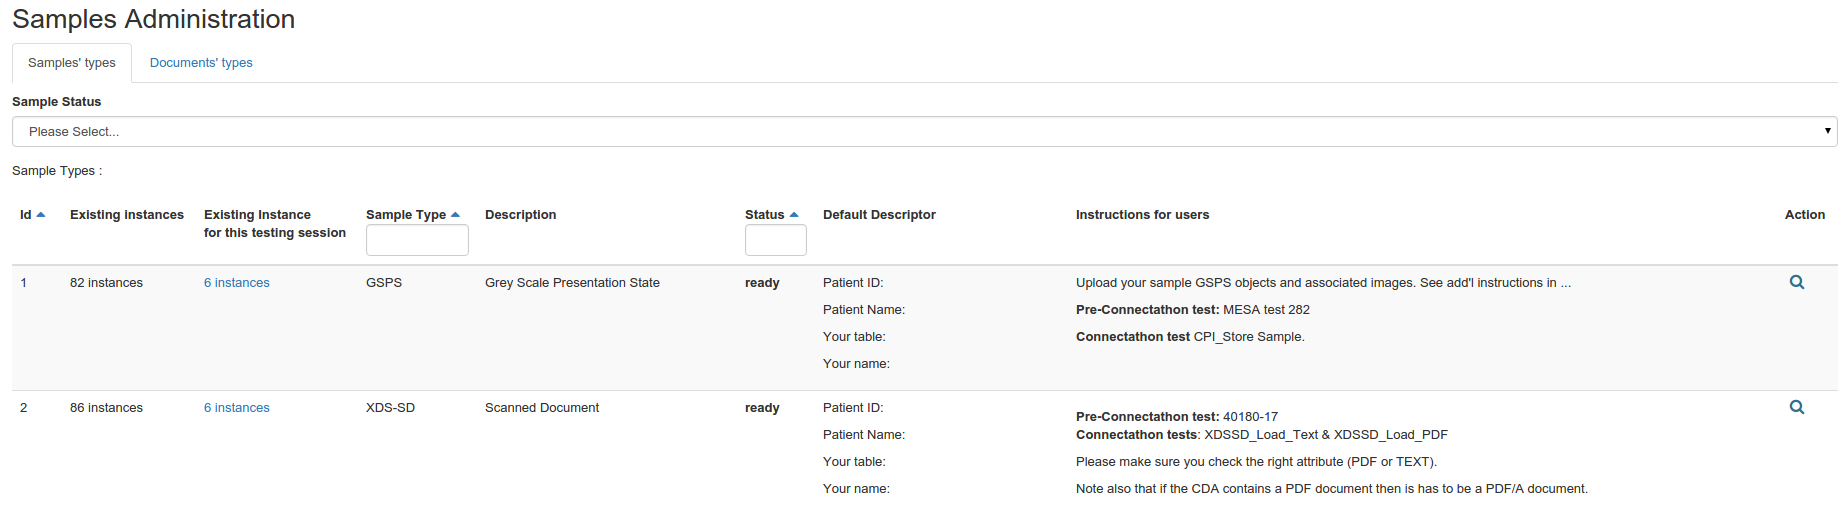
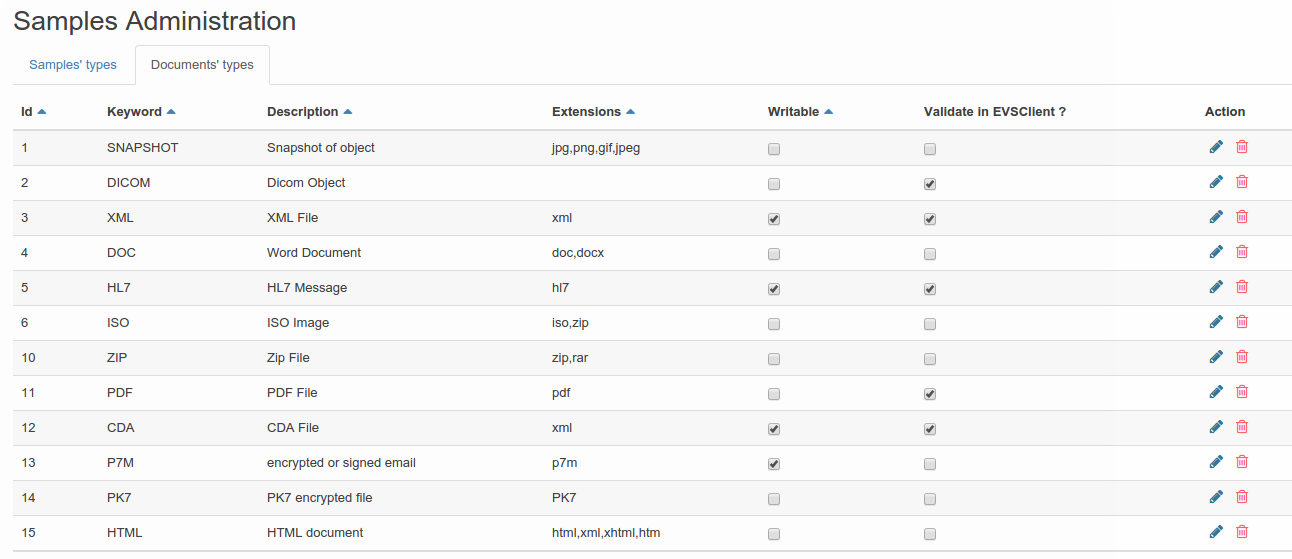
The module Sample management contain two panel : sample type management and document type management.
The document types are used to describe files used in sample type description.
Sample Type edition
To edit sample type, we use the icon edit
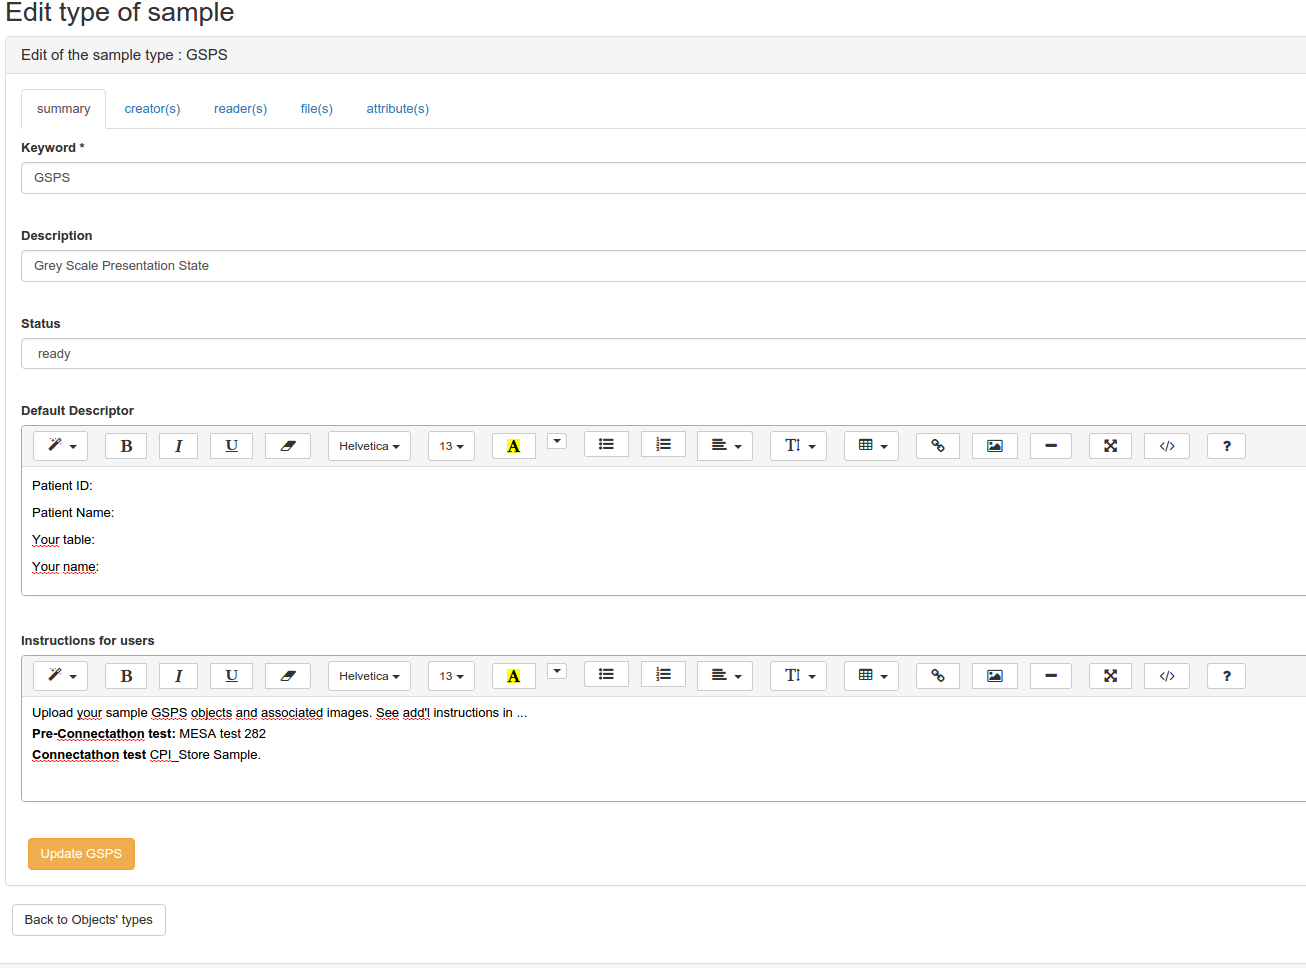
The GUI of edition of sample type contain :
- summary : the description of the sample type
- creators : the list of creators of the sample type
- readers : the list of readers of sample type
- files : the list of files related to the sample type
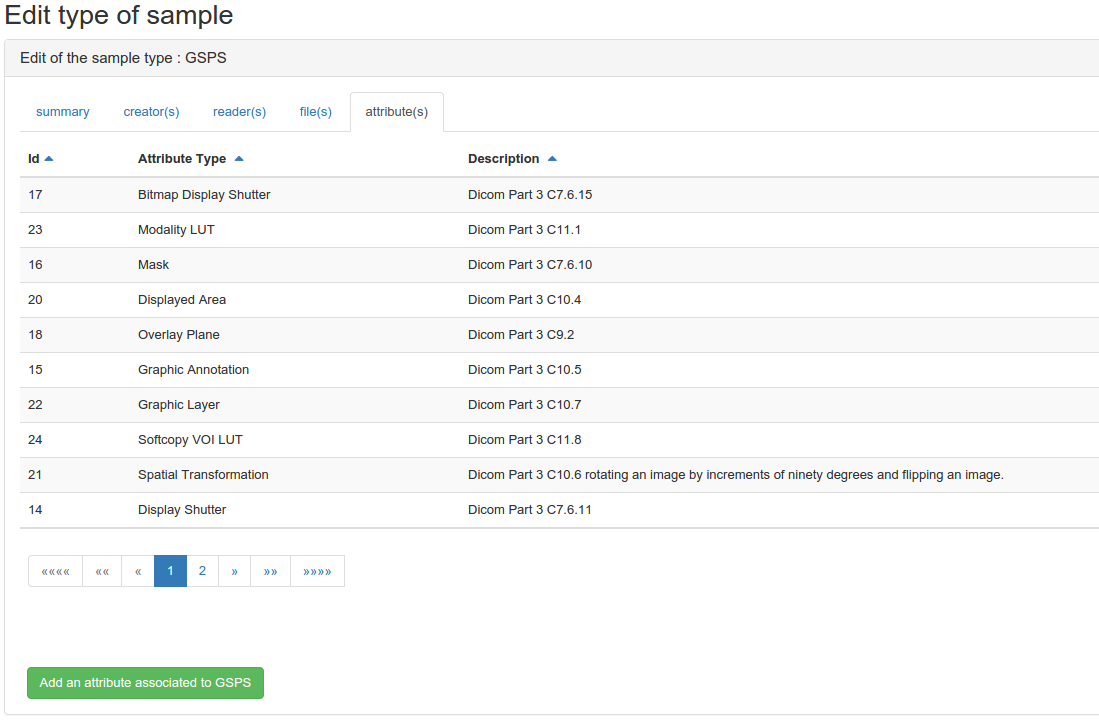
- attributes : the list of attributes that could be selected for the sample type
The creators of the sample type are defined by the list of AIPO that can create the sample. So, when a system implement an AIPO, and this aipo is a creator of the sample, the system can add files corresponding to the sample type defined.
The readers are also definded by the list of AIPO that can read the sample, and so when a system implements an AIPO , which is a reader of sample, the system could access to the list of sample uploaded by the creators, and even add comment, or upload files related to the sample type, as a reader.
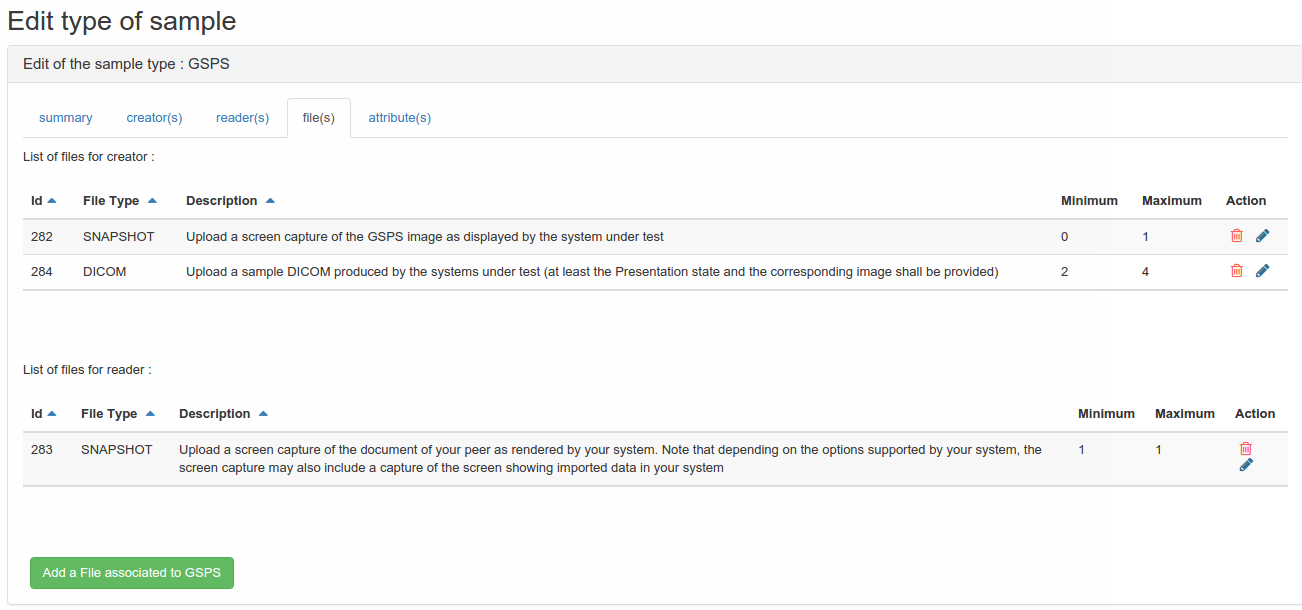 The edition of files contains two list: the list of files that could be uploaded by the creators, and the list of files that could be uploaded by the readers. Generally the readers can upload a snapshot of the rendering of the file of the creator.
Monitors Administration
The monitors are the persons who are present during the testing event to verify the tests performed by the SUT operators. The recruitment process is not descibed there neither the work of the monitor. This section focuses on how to set persons as monitor, how to say to which testing session they attend and how to create their list of tests, it means, what are the tests they will have to verify during the event.
First of all, all the users in Test Management who are aimed to be a monitor for a testing session shall have the “monitor_role” role. Refer to the User Administration part if you do not know how to grant users.
Manage monitors
Access the Manage monitors feature from Test Session > Manage monitors.
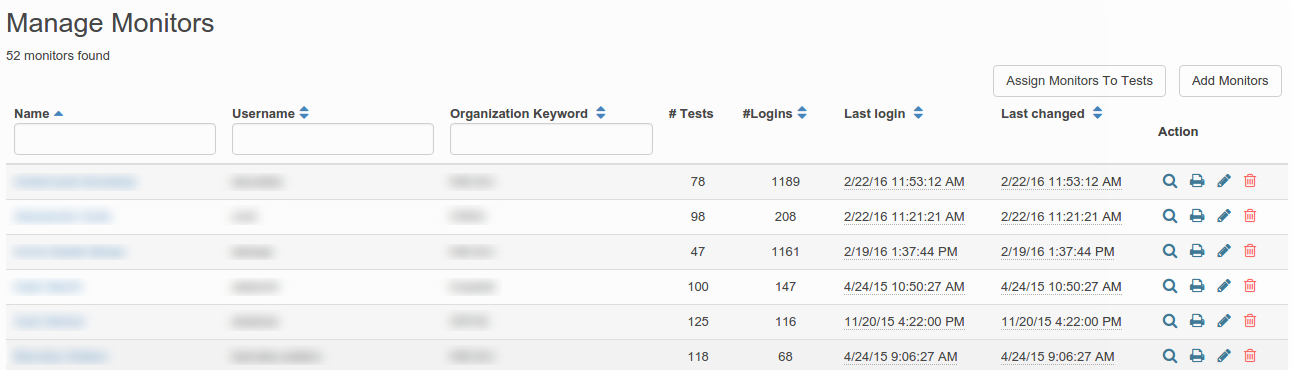
This page lists the monitors already link to the current testing session (the one you are currently logged into). For each monitor, beside his/her contact and connection information, you will get the number of tests which have been assigned to him/her. Note that above the table is given the number of monitors registered for the current event.
In the last column, buttons are available to view the detail of a monitor test list, print this test list, edit it or unassign the user from the list of monitors (the red cross).
When you edit the test assignments of a monitor, the list of already assigned tests is displayed, you can remove some of them by hitting the red cross. If you want to add some more, use the “Edit Test Assignment” button, il will open a new panel. You can filter the test either by domain, integration profile or actor. First select the criteria type, then select one domain or integration profile or actor and pick up the tests to assign to the current monitor.
Add the bottom of the page, two buttons are available : the first one will open the “Assign monitors to tests” page and the second one opens a new panel in which you can pick up the users to add to the list of monitors. Monitors are sorted by organization. When you have made your choice, do not forget to hit the “Add monitors to activated session” button (bottom right corner); this button shall be hit before moving to another organization.
Assign monitors to tests
If you prefer to assign the monitors to a list of tests instead of assigning a list of test to a monitor, you can use this feature. You will access it using the “Assign monitors to test” button on the Manage monitors page.
First, select a sub set of tests by applying filters. Then, click on the green tick in the Selection column. If you click on the icon located in the table header, it will select all the tests currently displayed in the table. To unselect a test / all the displayed tests, hit the grey tick.
When at least one test is selected, the number of monitors assigned to this selection is displayed below the table. Note that if several tests are selected, the number displayed represents the intersection of the monitors assigned to each test. If at least one monitor is assigned, the list is displayed below the table.
From this point, you can modify the list of monitors by clicking on the button “Modify list monitors”, pick up the ones to add (or to remove) and it the “Save modifications” button.

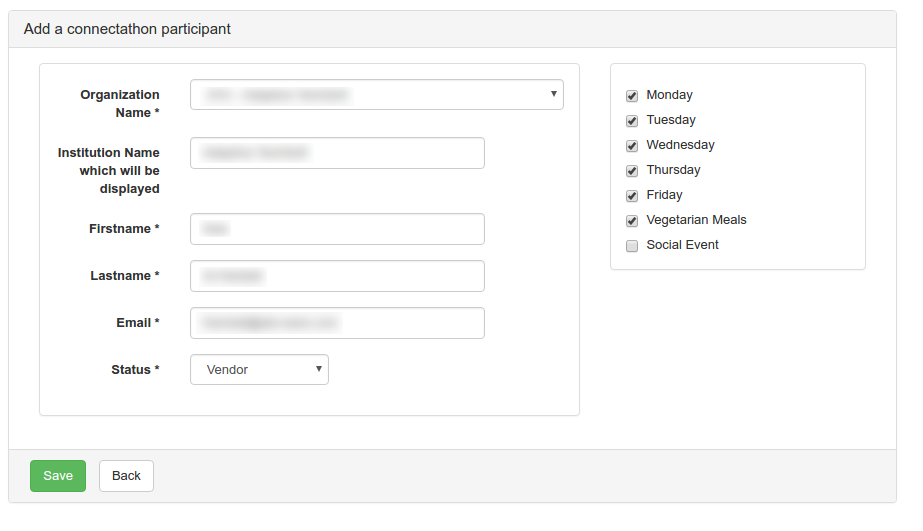
Testing Session Participants Management
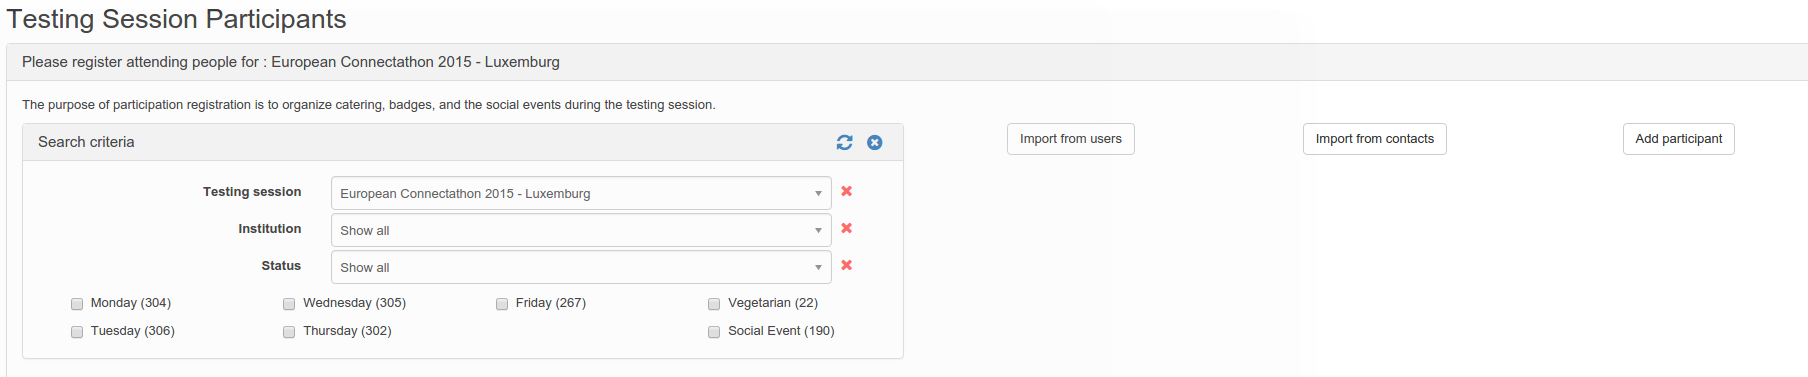
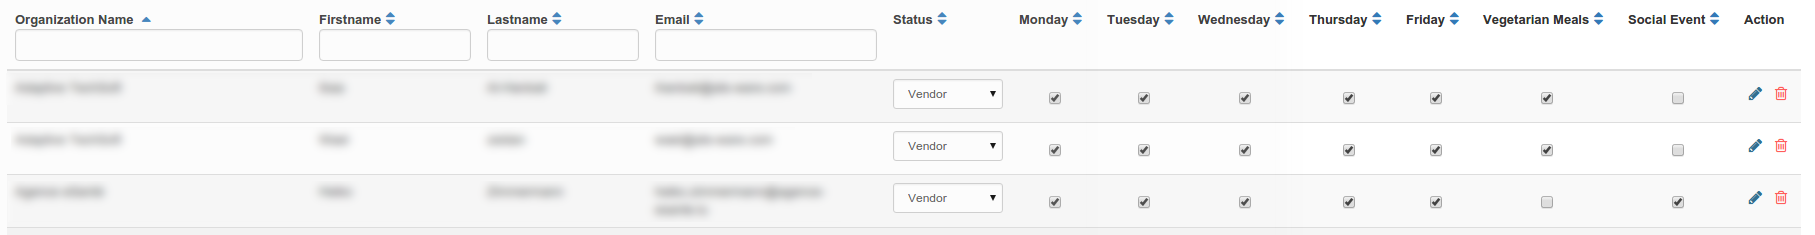
This feature is available under Test Session > Manage attendees.
It gives the administrator an overview of users attending to the connectathon. It helps planning the catering, tables…
A participant can register for some connectathon days, specify if he eats vegetarians and if he will attend the social event.
The administrator has an overview of who is going to attend the connectathon on moday, tuesday….
An administrator can add participants from the users list, contact list or create a new participant.
An administrator can remove a connectathon participant, or edit it.
An administrator can filter participants by organization
Edit testing session participants
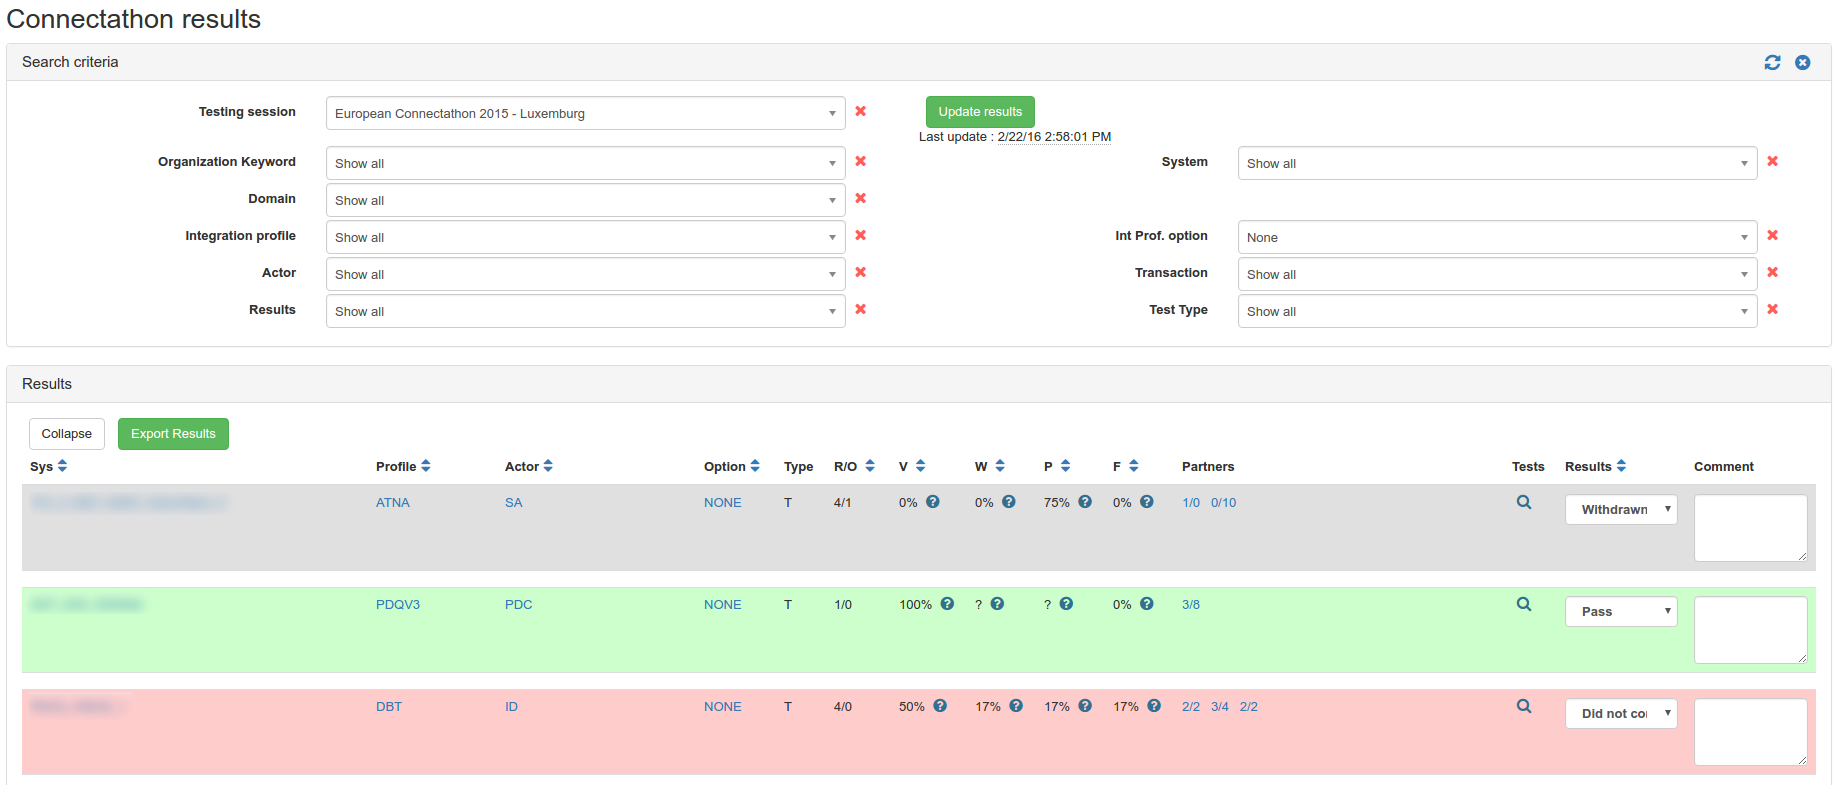
Evaluation
Evaluating the systems during a testing event is a manual process performed by the testing session managers. This section of the administration manual does not focus on the rules to grade system (they might be different depending on the testing events) but it describes how to do it with Gazelle Test Management.
You will access the Evaluation feature from the Evaluation entry in the top bar menu.
This page is divided into two parts; first you can filter the results and below the results (restrained to the filter criteria) are displayed.
In the first panel, a button labelled “Update results” can be used to force the update of the results. It will not grade the system, it will retrieve some information from the database like the number of test instances performed by each system and compute an indicator to help you with grading the systems.
In the table, a line is displayed for each actor / integration profile / option (AIPO) tuple registered by a system; in Test Management, results are given at system level even if we usually communicate the results at company level.
- The column “Type” tells you if the system is supportive (S) or Thorough (T) for this AIPO.
- Column “R/O” indicates the number of required vs optional tests to be performed by the system for this AIPO
- Column “V” indicates the percentage of verified (successful) test instances versus the number of expected successful test instances
- Column “W” indicates how many test instances are waiting for verification
- Column “P” indicates how many test instances are in state “Partially verified”
- Column “F” indicates how many test instances are failed
- In the “Partners” column, you will find, for each role involved in the test other than the one played by the system, the number of “used” partners versus the number of available ones. For each a tool tip give you the keyword of the role.
- In the Tests column, the magnifying glass opens a sub table which gathers all the test instances related to this AIPO. To close a sub-table, click again on the magnifying glass. To close all the sub tables you have previously displayed, use the “Close and reset all details” button available above the table.
- In the Results column, you can select the status for this line, it will be automatically saved
Finally, you can leave a comment to the user.
To help you focussing on the lines which need to be reviewed, lines are colourized and appears in grey if no result is set.
TM Functional Checking
This list of modules allows the admin to verify and to check the well functioning of the Test Management tool.
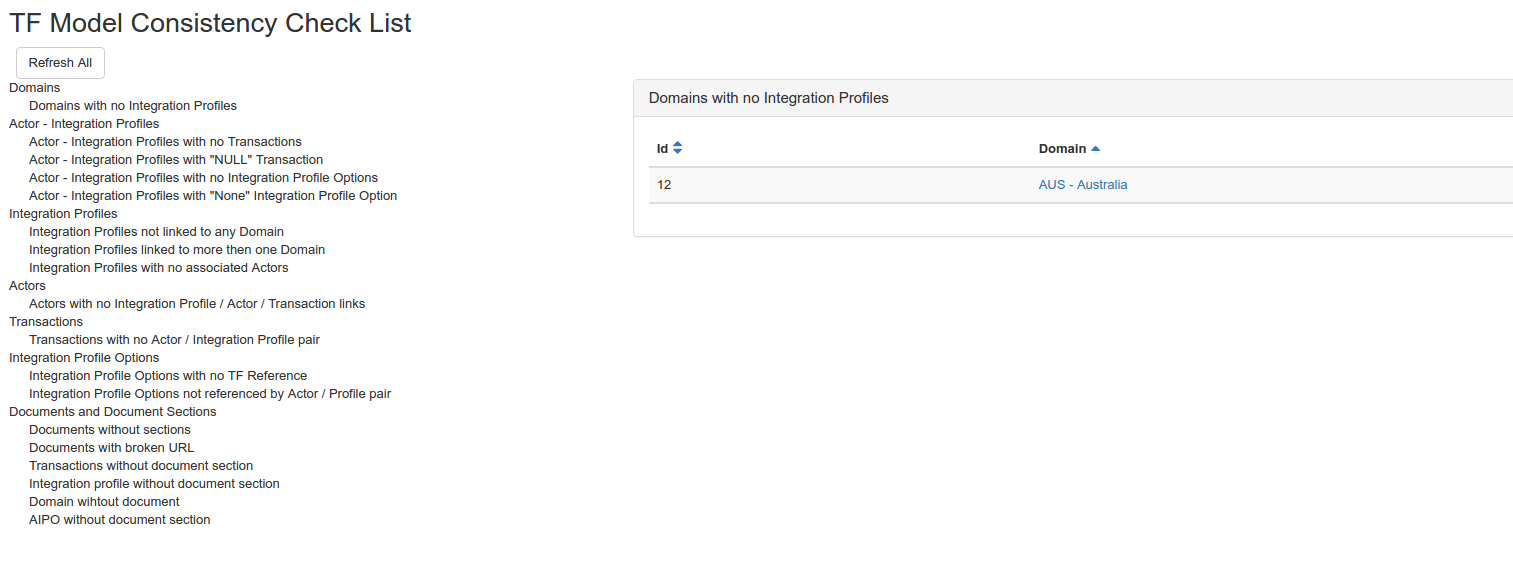
TF Model Consistency Check List
This module allows the admin to check the consistency between the different profiles/actors/domain defined in the database.
To access to this page, from the menu -> Specifications -> Specification model consistency.
This page allows to do the checking about the following objects:
- domains
- actors
- Integration profiles
- Actors
- Integration profile options
- Documents and Documents sections
Tests Definition CheckList
This module allows the admin to verify the consistency of the information in the test plan module. We could so verify if there are RoleInTest with no participant, or some test step instances with no test instances. Multiple check could be performed in this page.
To access to this page, you should go from the menu -> administration -> check -> Tests Definition CheckList

To access a check, you have to select the information looked for from the tree.
Sessions Dashboard
The session dashboard allows to access information about the current selected session.
The information provided are :
- Companies without participants
- Tests overview for systems/companies
- Test Instances Overview
To access to this page, you have to go to menu -> Test Session -> Dashboard.
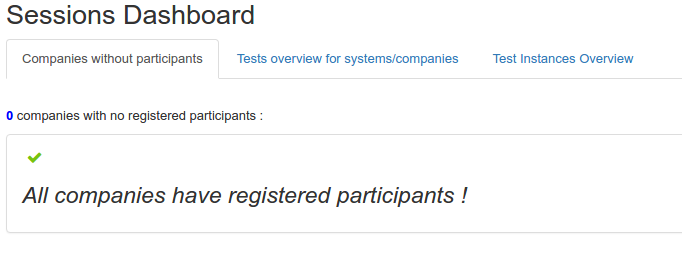
Companies without participants
This describe the companies that do not have a participants in the current testing session, and which are registred by a system.
Tests overview for systems/companies
This panel describes the list of systems registred in the testing session, and for each system we provide : the organization, the status of the system, the number of tests executed by the system during the CAT and the details about the results of these tests.
Gazelle KPIs
There are 4 types of KPIs. Those statistics are available under the Test Session menu.
- Test Execution statistics
- Test case statuses
- Monitoring of SUTs
- Monitoring of monitors
All KPIs can be exported in an excel file
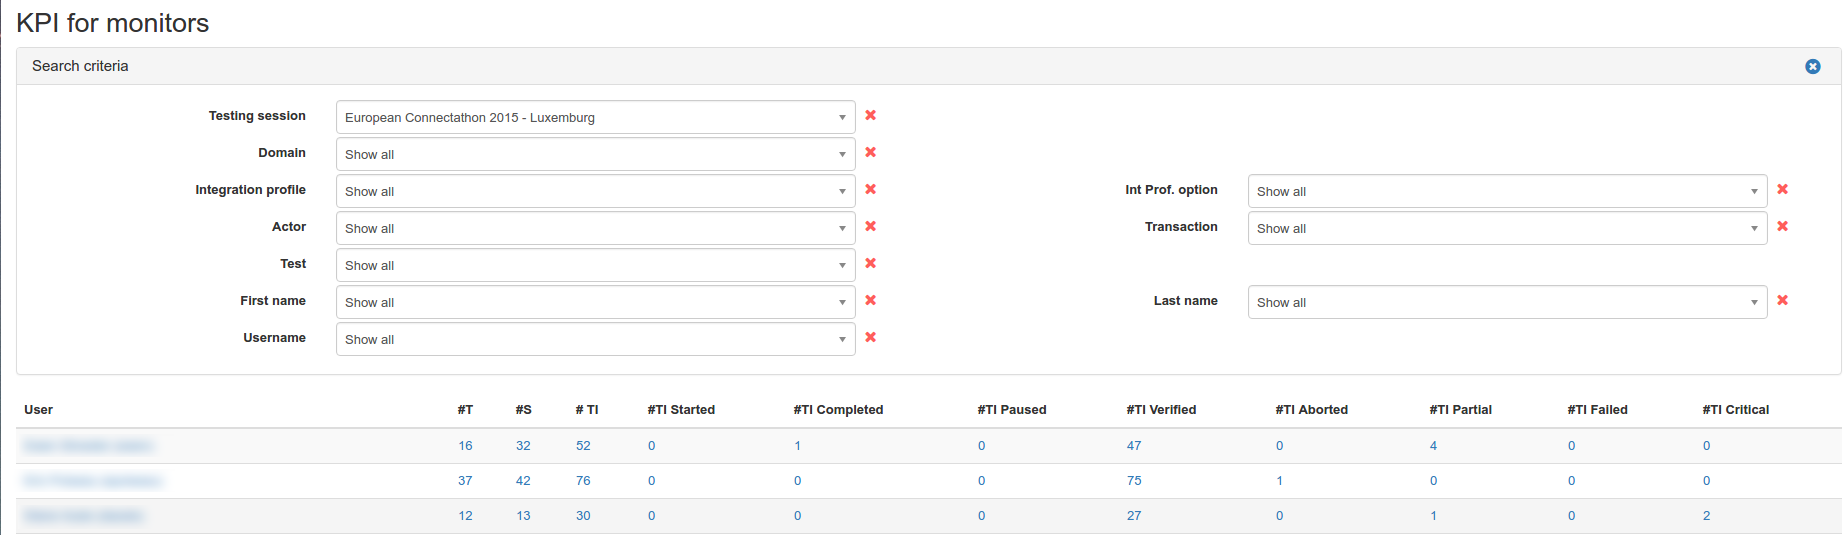
Monitoring of monitors
This page displays for each monitor the number of:
- test assigned
- systems in the session that the monitor can work with
- test instances claimed
- test instances claimed and started
- test instances claimed and completed
- test instances claimed and paused
- test instances claimed and verified
- test instances claimed and aborted
- test instances claimed and partial
- test instances claimed and failed
- test instances claimed and critical
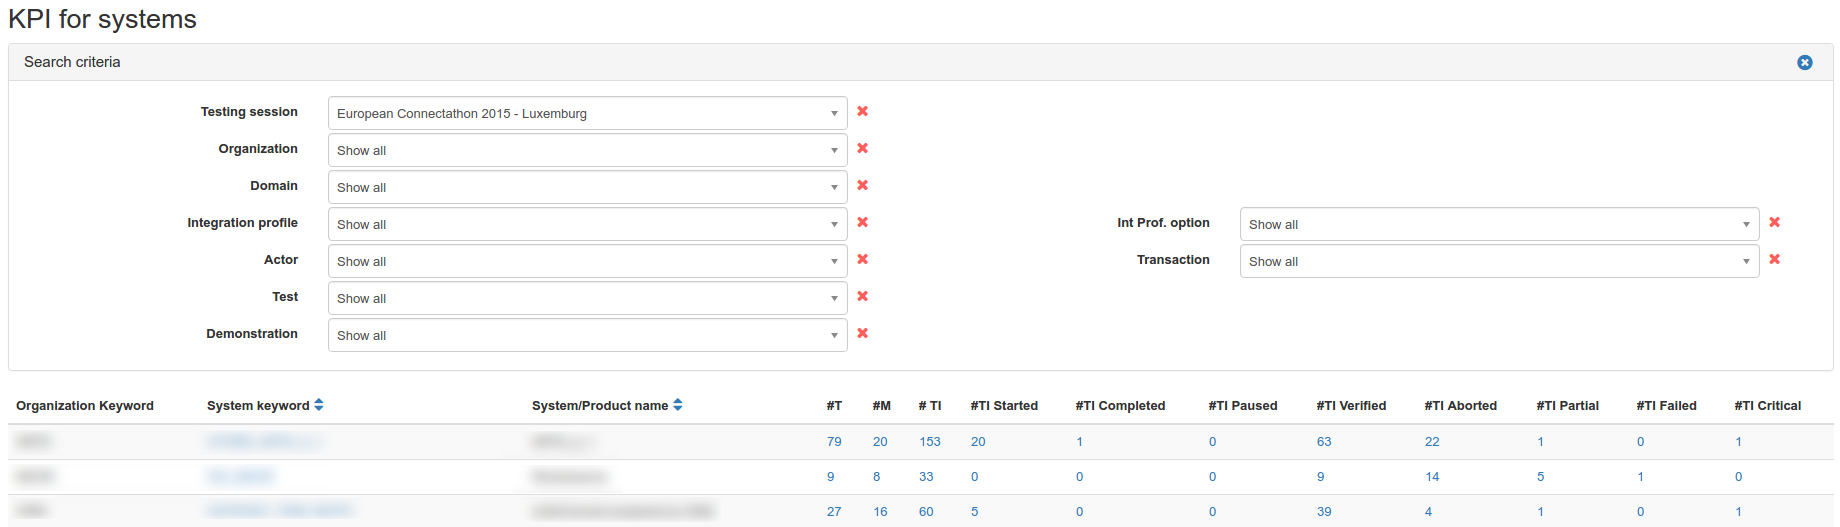
Monitoring of SUTs
This page displays for each system the number of:
- test to realize
- monitors involved
- test instances
- test instances started
- test instances completed
- test instances paused
- test instances verified
- test instances aborted
- test instances partial
- test instances failed
- test instances critical
Test case statuses
This page displays for each test the number of:
- monitors assigned to the test
- systems in the session that have to test it
- test instances
- test instances started
- test instances completed
- test instances paused
- test instances verified
- test instances aborted
- test instances partial
- test instances failed
- test instances critical
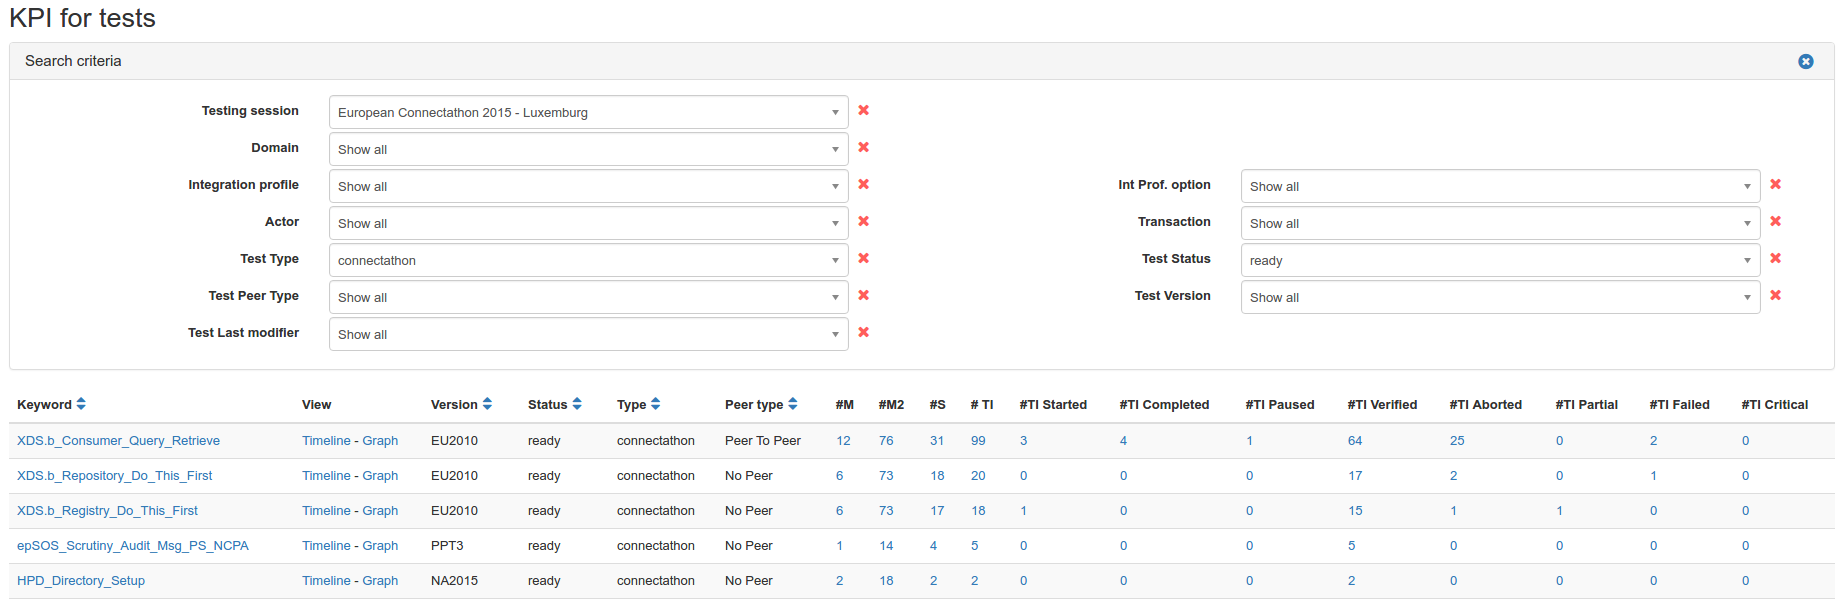
This page can be useful when you assign the test cases to the monitors since it automatically highlights:
- In red, the test cases to be executed by more than one system (for no-peer) or two systems (for peer-to-peer) but with no monitor assign to it. It is highly likely that test runs for this test case are created and remained unverified if you do not fix the test assignments of your monitor team;
- In orange, the peer-to-peer test cases to be executed by one system (no more) but with no monitor assigned.
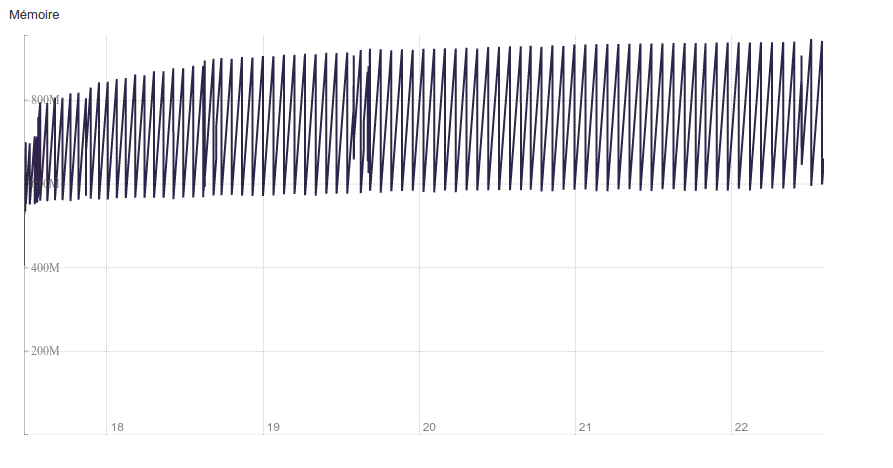
Gazelle Server Monitoring
This featuare is available under Administration > Server usage and allows you to monitor:
- memory usage through time
- active pages through time
- sessions through time
- session details
- caches usage
In graphs throught time, on the time axis you can move time cursors to zoom into a specific time.
Memory usage though time
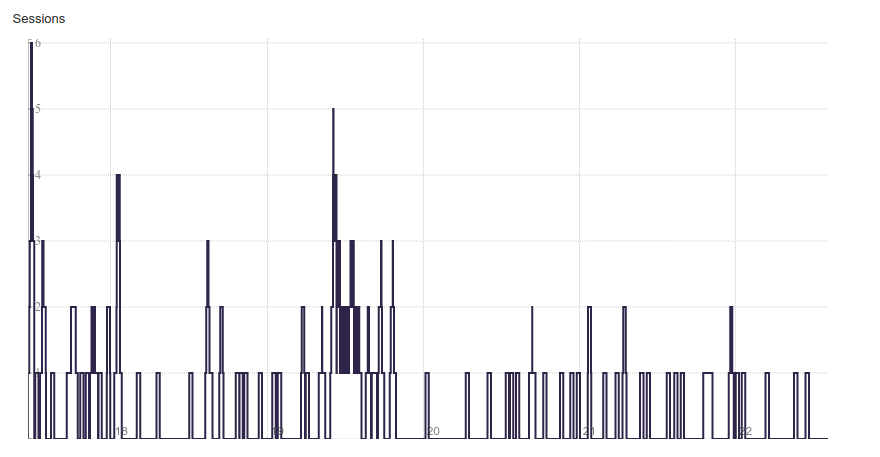
Sessions through time
Session details
